
Altcoins have been through a rough stretch, and it’s starting to feel different from past pullbacks. For five months in a row, the altcoin market has closed in the red. That has never happened before in crypto history.
Michaël van de Poppe pointed this out on X, saying the market is hitting a level of exhaustion that hasn’t shown up in previous cycles.
Social media interest is low, sentiment is dead, and most traders have simply stopped paying attention. That’s usually what long corrections look like near the end.
- What the ALT Chart Is Showing Right Now
- Could This Be the 2026 Altcoin Bottom?
- What Happens Next for Altcoins
What the ALT Chart Is Showing Right Now
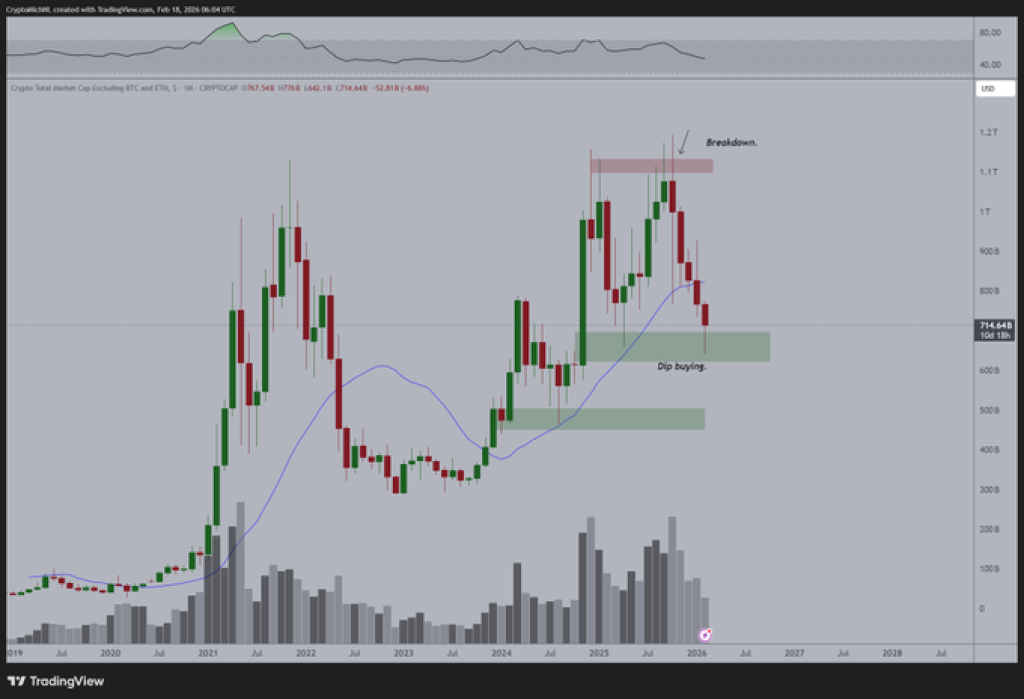
The chart makes the situation clear. Altcoins peaked hard in 2025, then rolled over into a steep drop. Since then, price has been sliding lower and lower, with each rebound getting sold off quickly.
Right now, the market is sitting in a zone where dip buying has started to show up again. You can see buyers stepping in around the green support area, trying to build a floor after months of downside.
The key issue is that the market is still below the major breakdown level near the top. Until altcoins reclaim that zone, the bigger trend remains weak.
Source: X/MichaëlvandePoppe
Meanwhile, five straight red months tells one story: capital has been leaving the altcoin space. Liquidity is tighter, risk appetite is low, and traders are sticking to safer positions instead of chasing smaller coins.
That’s also why interest online has collapsed. When prices grind down for this long, most people stop caring. The hype disappears, and only long-term holders remain. This kind of boredom is often what shows up near major turning points.
_****Top Analyst Reveals How to Make “Life-Changing Money” With Bitcoin (BTC) in 2026**
Could This Be the 2026 Altcoin Bottom?
Van de Poppe also noted that if this monthly candle can recover even slightly over the next few weeks, the odds increase that the correction is close to finished.
In simple terms, altcoins don’t need an instant breakout. They just need to stop collapsing. A higher close, a steady base, and some return of buying pressure would already be a major change after months of bleeding. If support holds, this could be the early stage of a bottom forming.
What Happens Next for Altcoins
The next few weeks matter. If the market continues holding the current support zone, altcoins may finally start stabilizing and building toward a stronger recovery later in 2026. But if this floor breaks, there is still room for another flush lower before a real bottom appears.
For now, the setup is clear: altcoins have never seen a losing streak this long, sentiment is washed out, and the market is sitting at a level where bottoms have formed in past cycles. The question is whether buyers step in soon, or if crypto winter still has one more leg left.
Disclaimer: The information on this page may come from third parties and does not represent the views or opinions of Gate. The content displayed on this page is for reference only and does not constitute any financial, investment, or legal advice. Gate does not guarantee the accuracy or completeness of the information and shall not be liable for any losses arising from the use of this information. Virtual asset investments carry high risks and are subject to significant price volatility. You may lose all of your invested principal. Please fully understand the relevant risks and make prudent decisions based on your own financial situation and risk tolerance. For details, please refer to
Disclaimer.
Related Articles
Today, the cryptocurrency Fear and Greed Index is at 12, indicating the market is in extreme fear.
Gate News Report, March 8th, according to Alternative.me data, today’s cryptocurrency Fear and Greed Index is at 12, indicating the market is in a "Extreme Fear" state. This index measures market sentiment, with lower values indicating higher levels of fear.
GateNews5m ago
CryptoQuant Analyst: Bitcoin NUPL-MVRV indicator reaches 0.33, indicating that extreme selling conditions are moderating
Gate News Announcement, March 8 — CryptoQuant analyst Axel posted on X platform that Bitcoin may have entered the mid-stage of this bear market cycle. Data shows that the NUPL–MVRV harmonic composite indicator has reached 0.33, while historical cycle bottoms typically occur around the -0.5 level. The chart indicates that the start of the bear market cycle is trending upward, suggesting that extreme selling conditions are moderating. However, the indicator remains well above historical bottom levels, indicating that a full-scale market sell-off has not yet been confirmed.
GateNews44m ago
Polkadot to Reset Tokenomics on March 12 With Major DOT Supply and Staking Changes
Polkadot will introduce a new monetary framework on March 12 that sets DOT’s supply cap at 2.1 billion and lowers emissions by 53.6%.
The overhaul will also create a Dynamic Allocation Pool and shorten the DOT unbonding period from 28 days to 24–48 hours.
On March 12, Polkadot will reset
CryptoNewsFlash4h ago
Bitcoin May Be Closer to a Bottom Than Most Think, Chart Signals
The Bitcoin price slipped about 2% today, trading slightly below $68,000 after pushing above $73,000 earlier this week, as already covered on our site. The move added fresh pressure to a market that still feels shaky, especially after several failed attempts to hold higher levels.
Still, not e
CaptainAltcoin4h ago
Dogecoin Monthly Breakdown Pattern Reappears as Price Tests $0.0918
Dogecoin is currently trading at $0.09205 at a gain of 2.3, with support of above $0.08878.
As can be seen in the monthly chart, there are recurring breakdown areas that have been followed by significant expansions in price.
The short-term trading range is narrow and the immediate point o
CryptoNewsLand5h ago
Solana Eyes $90.6 Trigger Point as $83 Support Holds and Liquidation Pressure Builds
A large cluster of short positions faces liquidation if SOL reaches $90.6, potentially increasing volatility.
SOL trades between $83.00 support and $89.58 resistance, keeping price action compressed in the short term.
SOL posts a 0.8% daily gain and rises 0.7% against BTC, holding
CryptoNewsLand5h ago