
Optimism (OP) has been absolutely crushed. The token is now down roughly 97% from its all-time high, and the last month alone has brought another steep leg lower.
It’s the kind of chart that makes people ask the obvious question: does this token even have a future, or is it basically finished?
Altcoin Sherpa summed up the situation bluntly, saying there isn’t much reason for many of these tokens to exist anymore, with OP being a clear example. The numbers back that up. A 97% drawdown is not a normal dip. It’s a full cycle wipeout.
- The Optimism Chart Shows a Complete Breakdown
- Sherpa’s Point: OP Price It Might Bounce, But Not Lead
- So Is OP Basically Finished?
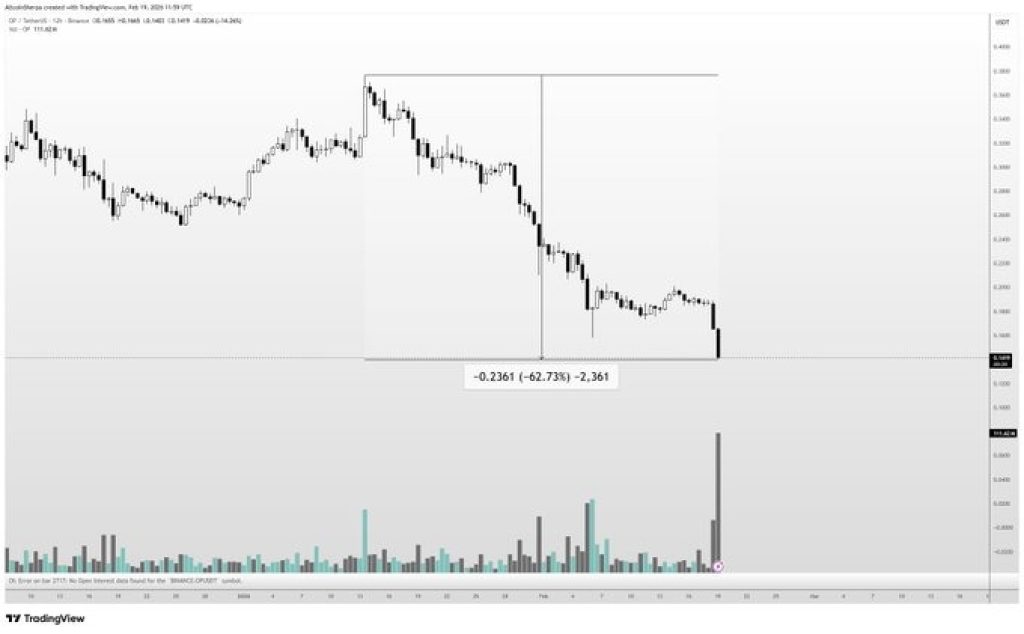
The Optimism Chart Shows a Complete Breakdown
Looking at the first chart, the OP price has been in a steady downtrend with almost no meaningful recovery attempts. The price keeps stepping lower, and every bounce has been sold quickly.
The recent move is especially ugly. OP dropped more than 60% in about a month, sliding straight into new lows. There is no clear base forming yet, and volume spikes on the way down show heavy selling pressure. This is what capitulation looks like.
_****A Once-in-7-Years XRP Pattern Is Back and Charts Show a Critical Countdown**
Source: X/AltcoinSherpa
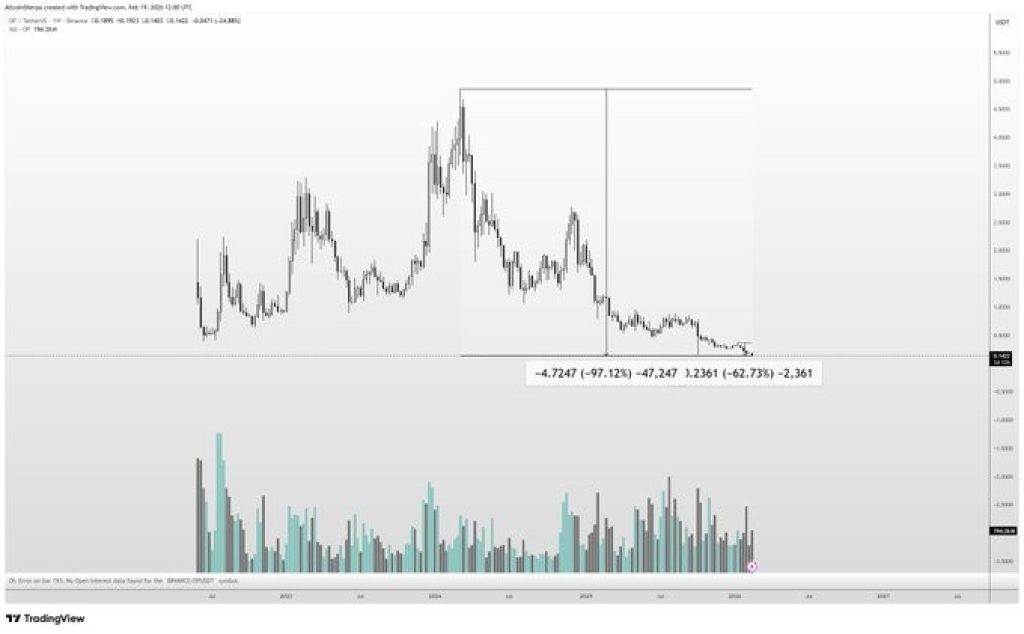
The second chart zooms out and shows just how far OP has fallen from the top. The token has basically given back the entire bull market move.
When something is down over 90%, it stops being about short-term volatility. It becomes a question of relevance.
Most investors who bought near the highs are still deeply underwater, and supply from trapped holders tends to hang over the chart for a long time. That is why these types of tokens often struggle to lead any recovery.
_****Why Bitcoin (BTC) and Crypto Prices Are Falling Again**
Source: X/AltcoinSherpa
Sherpa’s Point: OP Price It Might Bounce, But Not Lead
Altcoin Sherpa also made an important distinction. Even though OP looks broken right now, it would probably still do multiples off the lows when the next bullish environment returns.
That’s simply how crypto works. When liquidity comes back, beaten-down altcoins often bounce hard.
But the key point is that OP may not outperform the market. A token can rally in a bull phase without being a real leader.
Many projects pump simply because everything pumps, not because they have strong demand or new growth. That’s the risk with names that have already been through a full collapse.
_****Could This New Aptos (APT) Strategy Trigger a Comeback After a 95% Crash?**
So Is OP Basically Finished?
OP isn’t going to zero overnight, but the chart is sending a clear message. The market has lost confidence, the trend is still down, and the token is trading like a late-cycle loser.
A future bounce is possible if sentiment flips across crypto, but right now the OP price looks more like a recovery trade than a strong long-term leader.
Until the price finds a real base and demand returns, this remains one of the clearest examples of how brutal the altcoin bear market has been.
Disclaimer: The information on this page may come from third parties and does not represent the views or opinions of Gate. The content displayed on this page is for reference only and does not constitute any financial, investment, or legal advice. Gate does not guarantee the accuracy or completeness of the information and shall not be liable for any losses arising from the use of this information. Virtual asset investments carry high risks and are subject to significant price volatility. You may lose all of your invested principal. Please fully understand the relevant risks and make prudent decisions based on your own financial situation and risk tolerance. For details, please refer to
Disclaimer.
Related Articles
Aster Price Nears $0.79 Breakout as Reversal Pattern Strengthens
Key Insights
Aster price structure shows an inverse head and shoulders pattern forming beneath $0.79 resistance, signaling growing buying pressure and possible trend reversal ahead.
Repeated tests of the $0.79 neckline suggest weakening selling pressure as buyers steadily absorb supply
CryptoFrontNews2h ago
The HYPE price could surge despite the upcoming $2.8 million short squeeze.
The recent price movements of Hyperliquid (HYPE) are characterized by stagnation around 30 USD. A symmetrical triangle pattern indicates potential for a breakout in either direction, but market sentiment is cautious. Short squeeze risks may boost prices, while weak market flow and deteriorating demand pose challenges. The token could face significant support levels if it dips below 30 USD. An improved market sentiment could lead to a breakout above 33 USD, sparking recovery momentum.
TapChiBitcoin2h ago
Ethereum Price Holds Key Support: Is $2,200 the Next Test for ETH?
March 6, 2026 7:15 pm EST
TheCoinRepublic4h ago
Cardano Price Trends: Bulls Eye Opportunity as Indicator Flashes Green
ADA: Trading near $0.27, facing resistance at $0.28 and support at $0.26.
Technical Indicators: RSI and MACD show weak momentum, signaling short-term consolidation and cautious trading.
Macro Outlook: Rising PMI and historical patterns suggest potential bullish rebound if resistance
CryptoNewsLand5h ago
CryptoQuant: Bitcoin NUPL--MVRV indicator reaches 0.33, or has entered the mid-stage of a bear market
Gate News Announcement, March 7th, CryptoQuant analyst Axel pointed out on the X platform that the Bitcoin NUPL--MVRV harmonic composite indicator has reached 0.33, while historical cycle bottoms typically occur around the 0.5 range. The chart shows that the bear market cycle is beginning to shift upward, indicating that Bitcoin may have entered the mid-stage of this bear market cycle, suggesting that extreme selling conditions are easing. However, this indicator is still well above historical bottom levels, implying that a market-wide bottom has not yet been confirmed.
GateNews5h ago
ZEC Price Analysis: Upcoming Trends and Targets for the Next Few Weeks
ZEC: Stabilized near $200 support, rebounding toward $250 resistance after prolonged bearish pressure.
Technical Indicators: RSI and MACD show gradual improvement, signaling moderate bullish momentum returning.
Market Outlook: Sustained above $240 could push ZEC toward $268, while
CryptoNewsLand6h ago