
Kaspa (KAS) has been busy on the development side, even though price has been under pressure with the rest of the market.
The network crossed 600 million total transactions, showing strong usage and throughput. A new smart contract language called Silverscript was also announced, opening the door for native DeFi directly on Kaspa’s Layer 1.
On the institutional front, Zodia added custody support and a regulated ETP launched in Sweden. Despite those headlines, KAS is trading around $0.03081, and the chart still looks cautious.
- Here’s What The KAS Chart Is Showing
- What the Indicators Are Showing
- Kaspa Price Targets to Watch This Week
Here’s What The KAS Chart Is Showing
On the 4H chart, the Kaspa price has been drifting lower for weeks.The pattern indicates lower highs, with the price being squeezed in a tight range around $0.030.
There was a recent pullback that temporarily took the price lower, but the buyers acted quickly. Since then, KAS has been moving sideways, holding just above the $0.030 level.
That area is now acting as short-term support. Right now, this looks more like consolidation than a breakout setup.
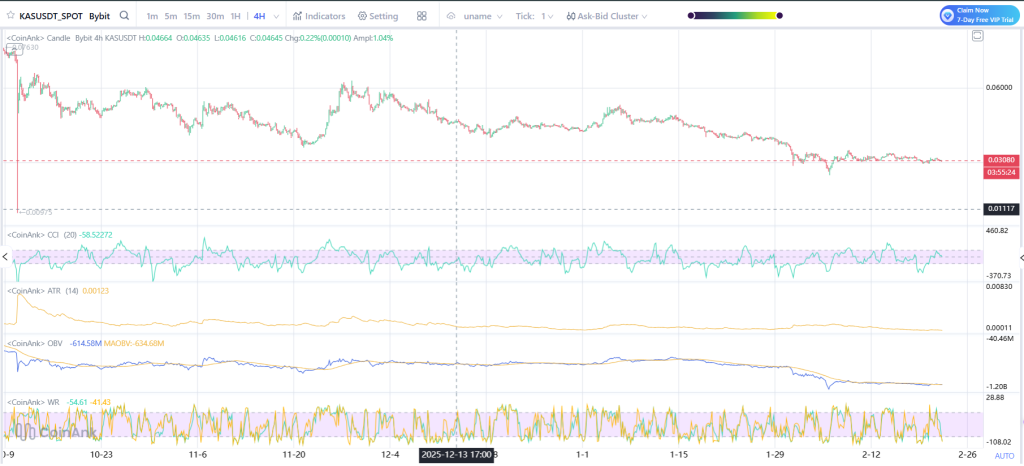
Source: Coinank
What the Indicators Are Showing
The CCI is hovering slightly above zero, which shows momentum is neutral. It is not deeply oversold, and it is not showing strong upward strength either.
ATR has dropped compared to earlier moves, which means volatility is cooling off. When volatility contracts like this, it usually means the market is waiting for a larger move.
OBV has been slowly trending down, which shows that buying pressure has not returned in a strong way yet. Volume has not picked up in a convincing manner.
However, the KAS price is stable, but there is no strong bullish push on the chart right now.
_****XRP Price Just Flashed a Historic Capitulation Signal**
Kaspa Price Targets to Watch This Week
If KAS holds the $0.030 level and starts pushing up, $0.033 is the first area to watch. Above that, $0.036 is the next hurdle since price broke down from there before.
If the buying pressure increases and the market becomes stable, KAS may move towards $0.040. If $0.030 breaks, the next target could be $0.027. Below that, $0.025 is the next level of support.
For now, the KAS price is boxed in. A clear move above $0.033 or below $0.030 will likely set the tone for the rest of the week.
Disclaimer: The information on this page may come from third parties and does not represent the views or opinions of Gate. The content displayed on this page is for reference only and does not constitute any financial, investment, or legal advice. Gate does not guarantee the accuracy or completeness of the information and shall not be liable for any losses arising from the use of this information. Virtual asset investments carry high risks and are subject to significant price volatility. You may lose all of your invested principal. Please fully understand the relevant risks and make prudent decisions based on your own financial situation and risk tolerance. For details, please refer to
Disclaimer.
Related Articles
TRUMP Token Whales Hit Five-Month High, Trump Dinner Effect Drives 36% Surge
Trump meme coin TRUMP surged approximately 36% following the announcement of an exclusive dinner event, with whale holdings reaching a five-month high. Large holders are actively increasing positions, but losses are also present in the market, indicating divergent investment behavior. Controversy sparked by political criticism may have limited impact on market performance, but regulatory investigation risks remain a concern to monitor.
MarketWhisper23m ago
Bitcoin Spot ETF Saw $760 Million in Inflows Last Week! But Whether the Rally Continues Requires Monitoring 3 Key Factors
US cryptocurrency spot ETFs showed a significant rebound last week, with Bitcoin and Ethereum recording net inflows of approximately $763.4 million and $160.9 million respectively, with prices bouncing back accordingly. Although the market is showing incremental buying signals, it still faces variables from central bank policies and geopolitical risks in the future. The market will continue to monitor ETF capital inflows and macroeconomic impacts.
CryptoCity37m ago
Market rally continues! Bitcoin returns to $75,000 level, ETF inflows persist
Bitcoin broke through $74,000 on March 16 as institutional capital flowed back into the market, with ETF net inflows reaching $1 billion, shifting market sentiment to bullish. Analysts predict Bitcoin could reach $80,000, but it is currently in a consolidation phase. $75,000 is a key resistance level; a breakout could lead to a test of $90,000, otherwise it risks a pullback.
区块客45m ago
MICA Daily | BTC Stable Above 30-Day Moving Average, Continues to Show Bullish Outlook
According to Binance data, Bitcoin's moving average convergence divergence indicator shows significant improvement in its price trend structure, with current trading price around $73,000, and moving averages in a divergent state, reflecting a market transition phase. Technical analysis indicates that the 30-day moving average is of high importance; if the price maintains above this moving average, it indicates buying support, otherwise it may enter a correction phase. Investors will judge the trend based on changes in moving averages.
区块客48m ago
Bitcoin Surges Toward $75,000: $600 Million Short Liquidations Drive Rally, ETF Inflows Emerge as Key Variable
On March 17, Bitcoin tested the 75,000 US dollar level driven by short liquidations, briefly reaching 75,653 US dollars before retreating. This rally was accompanied by massive liquidations totaling approximately 609 million US dollars in 24 hours, with shorts accounting for a significant proportion. Market sentiment has recovered somewhat, with capital inflows into spot demand and ETF support driving Bitcoin's rally. Future price movements will be influenced by sustained capital inflows and macroeconomic data.
GateNews1h ago
