
Several institutional investors have disclosed through their latest quarterly 13F filings that they have significantly reduced or completely liquidated their holdings in MicroStrategy (MSTR), including Angeles Wealth Management and Wealth Watch Advisors, both announcing 100% exits. Although MSTR’s stock price rebounded approximately 30% after hitting a bottom in early February, it still declined a total of 19% over the past month.
Institutional 13F Filings Reveal Systematic Liquidation Trend
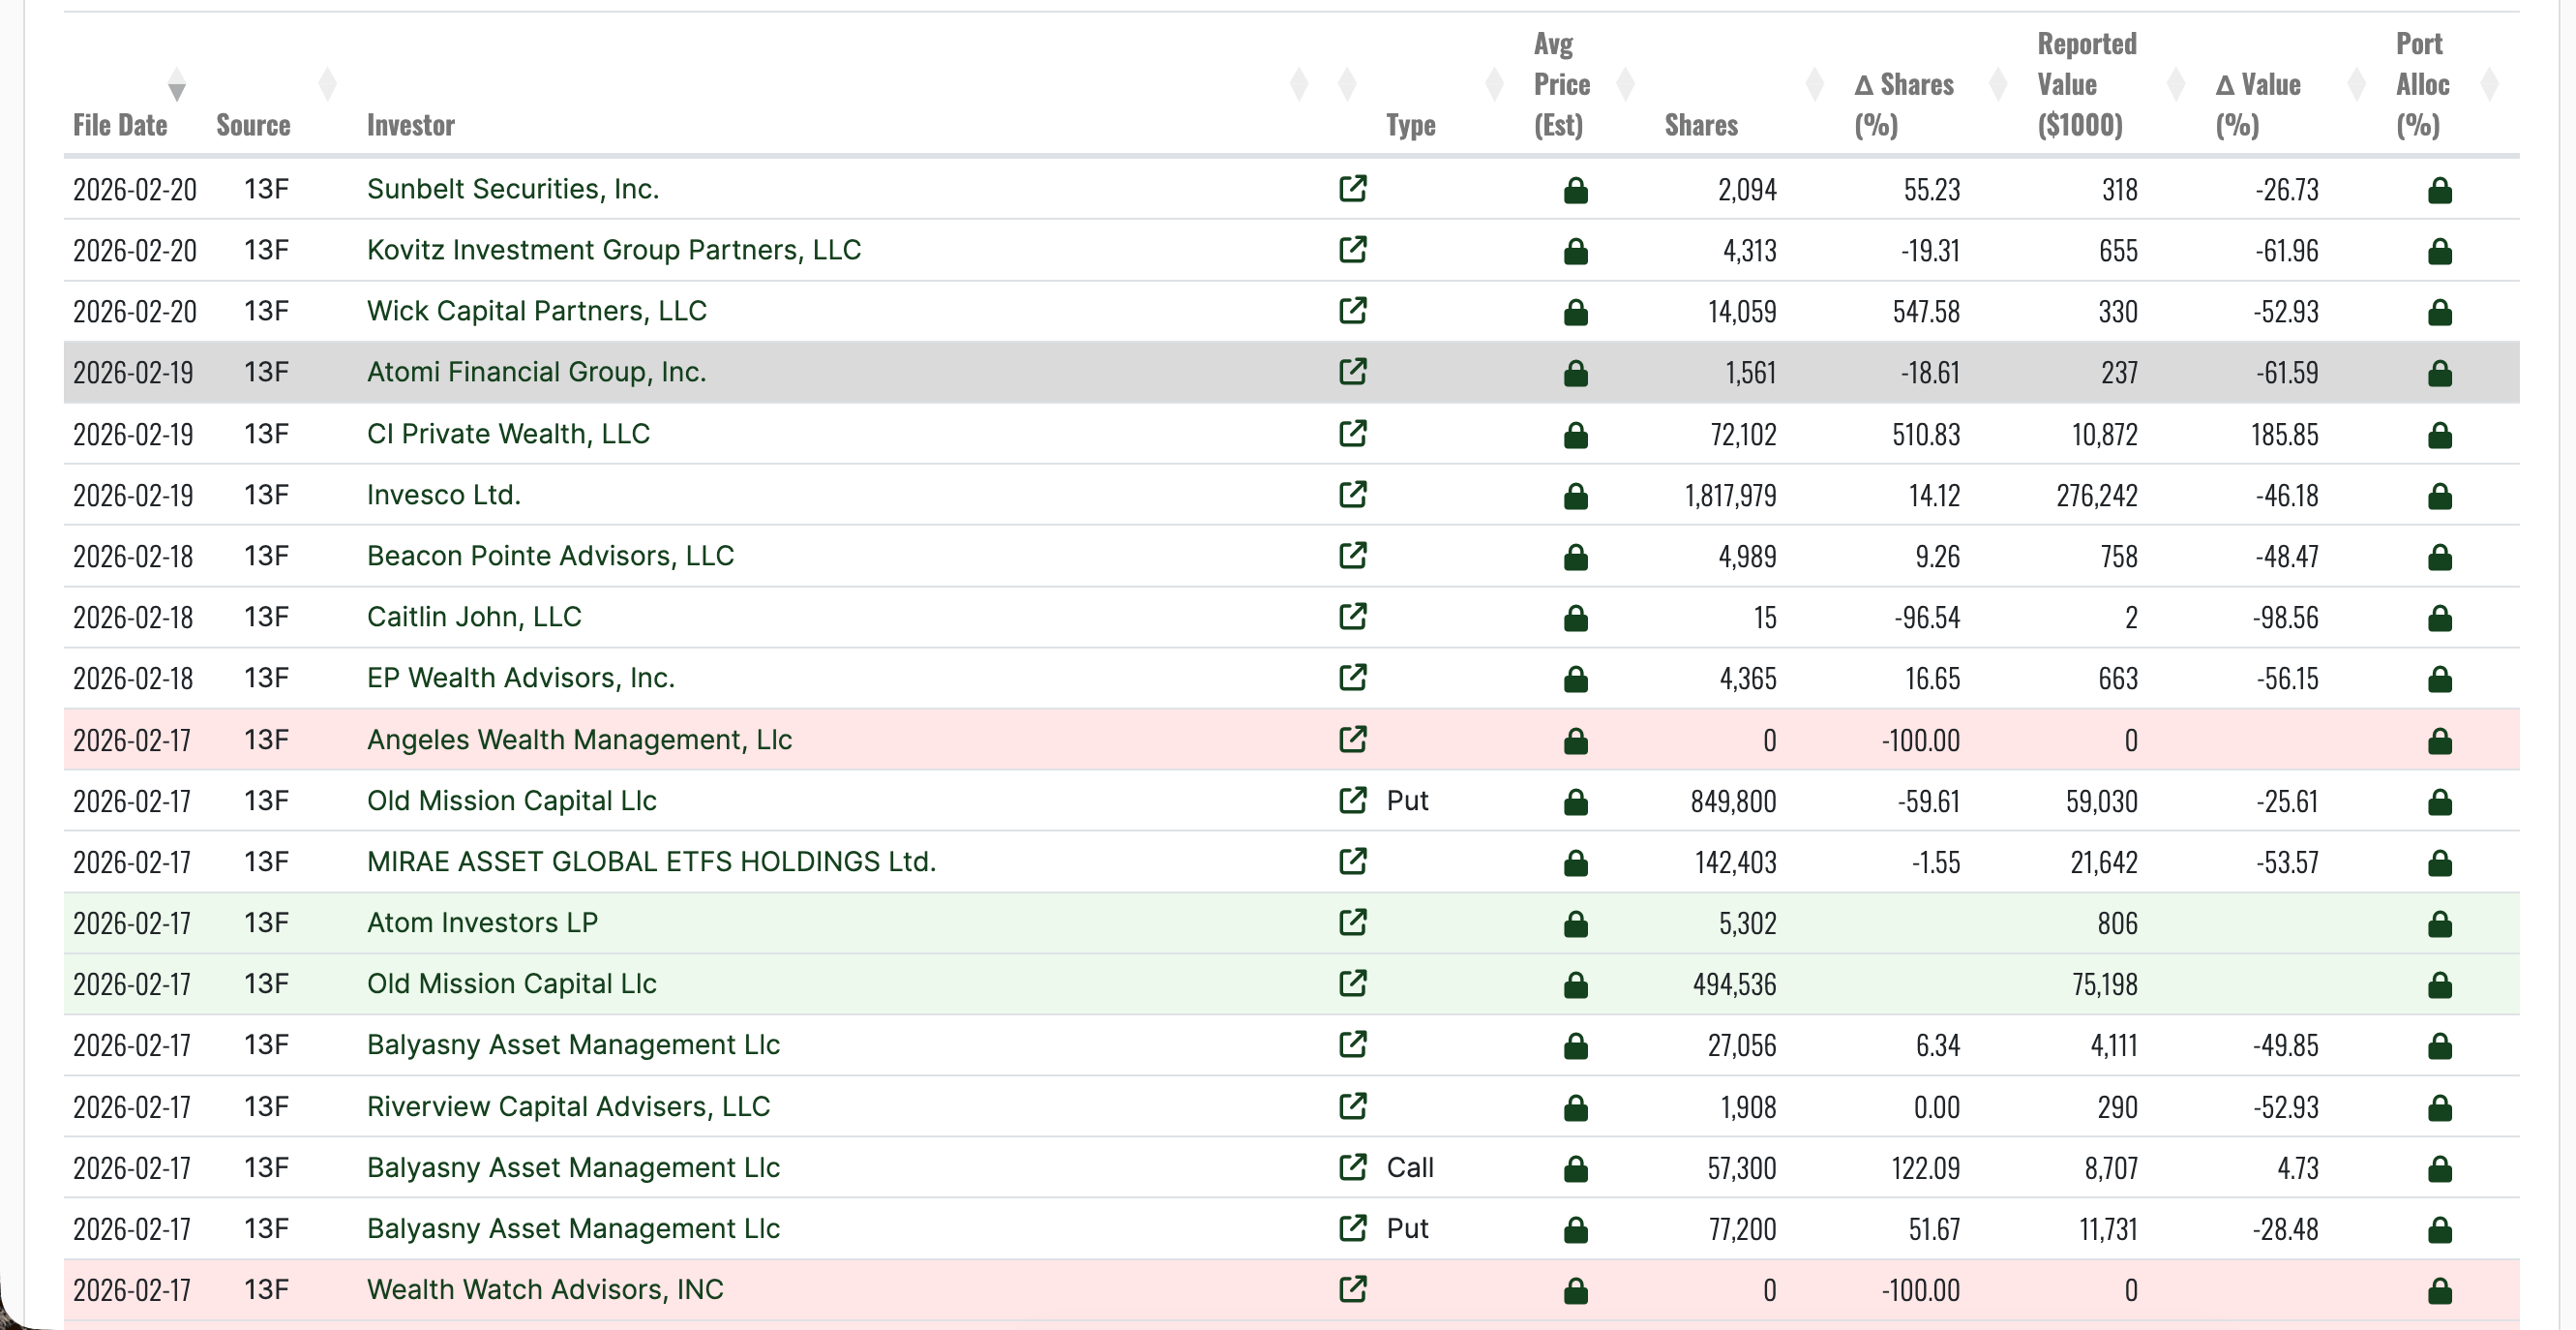
(Source: Fintel)
The 13F is a quarterly report filed with the U.S. Securities and Exchange Commission (SEC) by institutional investment managers overseeing over $100 million. It discloses their holdings, typically with a 45-day delay, reflecting decisions made at the end of the previous quarter. The concentrated disclosures from multiple institutions indicate that during MicroStrategy’s recent decline cycle, institutional funds generally chose to reduce or exit their positions.
Overview of Major Institutional Holdings Adjustments
Angeles Wealth Management: Fully liquidated, 100% reduction
Wealth Watch Advisors: Fully liquidated, 100% reduction
Caitlin John LLC: Reduced by 96.54%, retaining only symbolic holdings
Kovitz Investment Group: Reduced by 19.31%, with holdings value down over 62% in the same period
Atomic Financial Group: Reduced by 18.61%, with holdings value down over 61%
Invesco Group: Increased holdings by 14.12% against the trend, but overall position value still down over 46%
During the rebound, the concentrated disclosures of liquidation by institutional investors are viewed by the market as a systemic sign of waning confidence.
Technical Indicators Issue Triple Warnings: Momentum Divergence Continues to Worsen
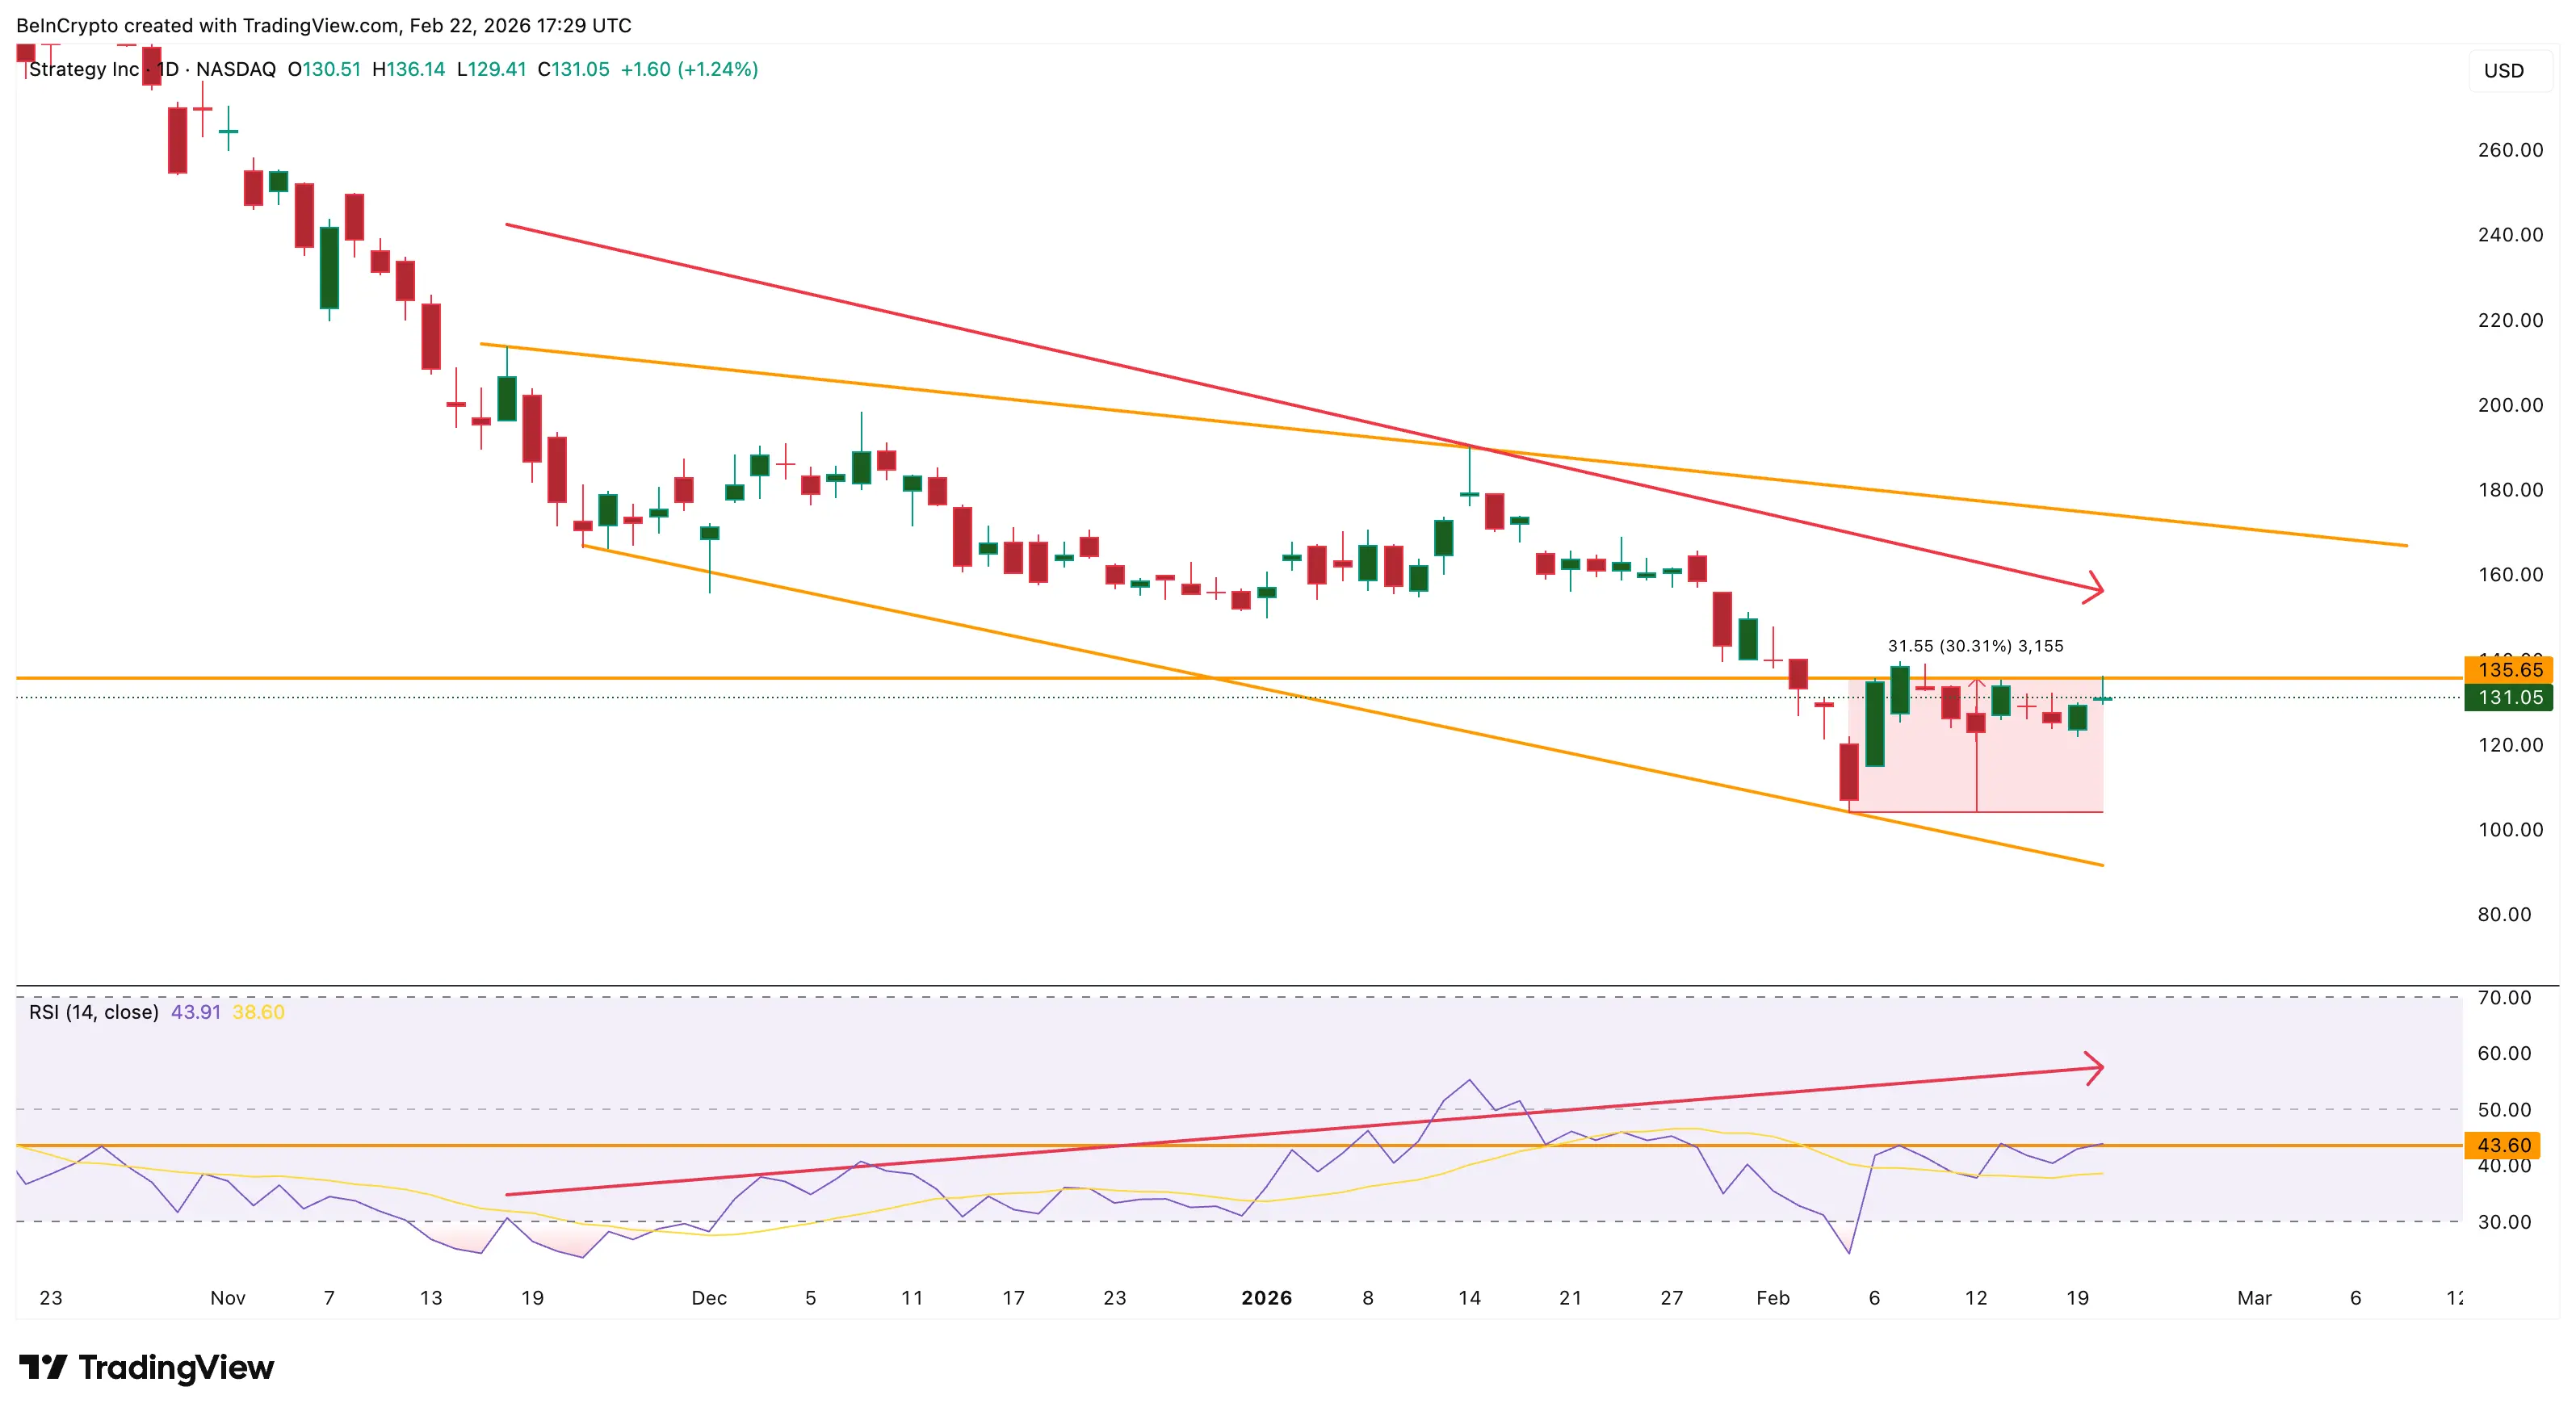
(Source: TradingView)
RSI Bearish Divergence
From November 18 to February 20, MSTR’s stock price formed lower highs, but the Relative Strength Index (RSI) showed higher highs, indicating a bearish divergence. This divergence appears within a sustained downtrend, suggesting that recent rebound momentum is gradually dissipating; if the price cannot effectively break above $135 resistance, the signal’s reliability will further strengthen.
Weakening OBV Indicates Dominant Selling Pressure
On-Balance Volume (OBV) has been declining since February 9, while the stock price has mostly moved sideways. The decline in OBV indicates that selling volume has been consistently higher than buying volume, suggesting that the current rebound lacks sufficient trading volume support, raising doubts about its sustainability.
MFI Shows Limited Retail Participation at Lows
The Money Flow Index (MFI) formed slightly higher lows between February 5 and 19, indicating some funds are buying at lows, which may explain why MSTR has remained above recent lows. However, without institutional funds re-entering, retail buying power alone usually cannot sustain a continued rebound.
Key Technical Levels: The Dual Test of $139 Resistance and $106 Support
MSTR is currently within a descending wedge pattern formed since November last year. The following technical levels will dominate the short-term trend:
$139: The 20-day Exponential Moving Average (EMA), a breakout above this could extend gains toward $163; the last test of this level in January saw the stock rise nearly 15% shortly afterward.
$119: Recent consolidation support; losing this level would significantly weaken the current rebound structure.
$106: Critical support level; a break below could trigger a chain of declines.
$96 / $86: Secondary supports after losing $106, with downside potential of 20% to 35% from current levels.
MicroStrategy currently holds over 717,000 BTC, and its stock price is highly correlated with Bitcoin’s market. Continued pressure on Bitcoin will directly amplify the aforementioned technical downside risks.
Frequently Asked Questions
What does the institutional liquidation disclosed in MicroStrategy’s 13F filings signify?
13F filings are quarterly disclosures required by the SEC for institutional managers overseeing over $100 million, with a 45-day lag. The significant reductions or complete liquidations disclosed by multiple institutions reflect decisions made at the end of the previous quarter, indicating that during the recent decline, institutions systematically reduced their exposure to MicroStrategy.
What are the key technical support levels for MSTR now?
The most critical support levels are $119 and $106. Technical analysis shows that if $106 is broken, support levels below are at $96 and $86. The key resistance to regain upward momentum is $139 (the 20-day EMA).
How does MicroStrategy’s Bitcoin holdings impact its stock risk?
MicroStrategy holds over 717,000 BTC, making its stock valuation highly dependent on Bitcoin’s market performance. If Bitcoin continues to face downward pressure, it will directly affect MicroStrategy’s asset valuation and magnify the downside risk of MSTR’s stock.
Disclaimer: The information on this page may come from third parties and does not represent the views or opinions of Gate. The content displayed on this page is for reference only and does not constitute any financial, investment, or legal advice. Gate does not guarantee the accuracy or completeness of the information and shall not be liable for any losses arising from the use of this information. Virtual asset investments carry high risks and are subject to significant price volatility. You may lose all of your invested principal. Please fully understand the relevant risks and make prudent decisions based on your own financial situation and risk tolerance. For details, please refer to
Disclaimer.
Related Articles
Expert Claims Altcoin Metrics Are Being 'Gamed' to Mislead Investors
Crypto researcher Orbion raises concerns over the possible manipulation of key market indicators, including the Altseason Index and Crypto Fear and Greed Index, suggesting that inflated metrics create false optimism and mislead investors about the onset of altcoin season.
Coinpedia26m ago
XRP Holds $1.34 Support as $1.80–$2.00 Becomes 2025 Make-or-Break Zone
XRP is trading at $1.37 and its trading higher than the support of $1.34 but facing a heavy resistance at $1.38.
The critical structural pivot zone of $1.80-2.00 is the critical 2025 structural pivot.
March structure has the targets of $2.78 and 3.60, with anticipated
CryptoNewsLand28m ago
XRP Slides to $1.42 After Losing $1.80–$2 Neckline as $1.39 Support Faces Immediate Test
XRP dropped to less than the $1.80-2 neckline and a key support area became an overhead and the overall trend was altered.
The current short-term trading corridor is between the support and resistance of the asset which is between $1.39 and $1.47 respectively.
A price above $1.39 will
CryptoNewsLand34m ago
Dogecoin Prints Monthly Morning Doji Star — Will $0.097 Break Next?
Dogecoin is forming a "Morning Doji Star" pattern on the monthly chart around $0.09, indicating a potential bullish reversal despite a recent 1.9% daily decline. Key support is at $0.09036 and resistance at $0.09707, with current trading at $0.09010.
CryptoNewsLand38m ago
Solana at $84: Two Liquidity Clusters Might Decide Next Move - U.Today
Solana's payments volume surges 755%, but its price drops 1.40% amid profit-taking and a stronger dollar. Market sentiment remains cautious, with two liquidity clusters forming at $95 and $78-$85, indicating potential future volatility.
UToday1h ago
PEPE Price Coils Within $0.053385–$0.053517 Band as Momentum Stays Balanced
PEPE is trading within a tight range, with support at $0.053385 and resistance at $0.053517. The token shows minimal daily gains and balanced momentum indicators, indicating potential for volatility. Despite limited movement against USDT, PEPE appreciates against BTC and ETH.
CryptoNewsLand1h ago