Ethena (ENA) recorded an 11.55% increase in open interest (OI) over the past 24 hours, as the price surged by an impressive 5.08%. The rise in speculative demand occurred as ENA recovered from a local support level at $0.094.
According to the latest report from Coinphoton, the market has seen a significant increase in large buy orders from whale investors in the spot market. These large buy orders, often seen during sharp price declines, are considered signals that smart money is entering, helping to slow down the downward trend.
However, this signal alone does not confirm that the market bottom has been reached. Analyzing price charts on higher timeframes suggests that ENA’s upward momentum may be only temporary.
Bullish Divergence and Healthy Correction of ENA
No market moves in a single direction for long, and ENA’s behavior is no exception. Throughout 2026, ENA maintained a downtrend with only occasional upward corrections to reduce continuous selling pressure.
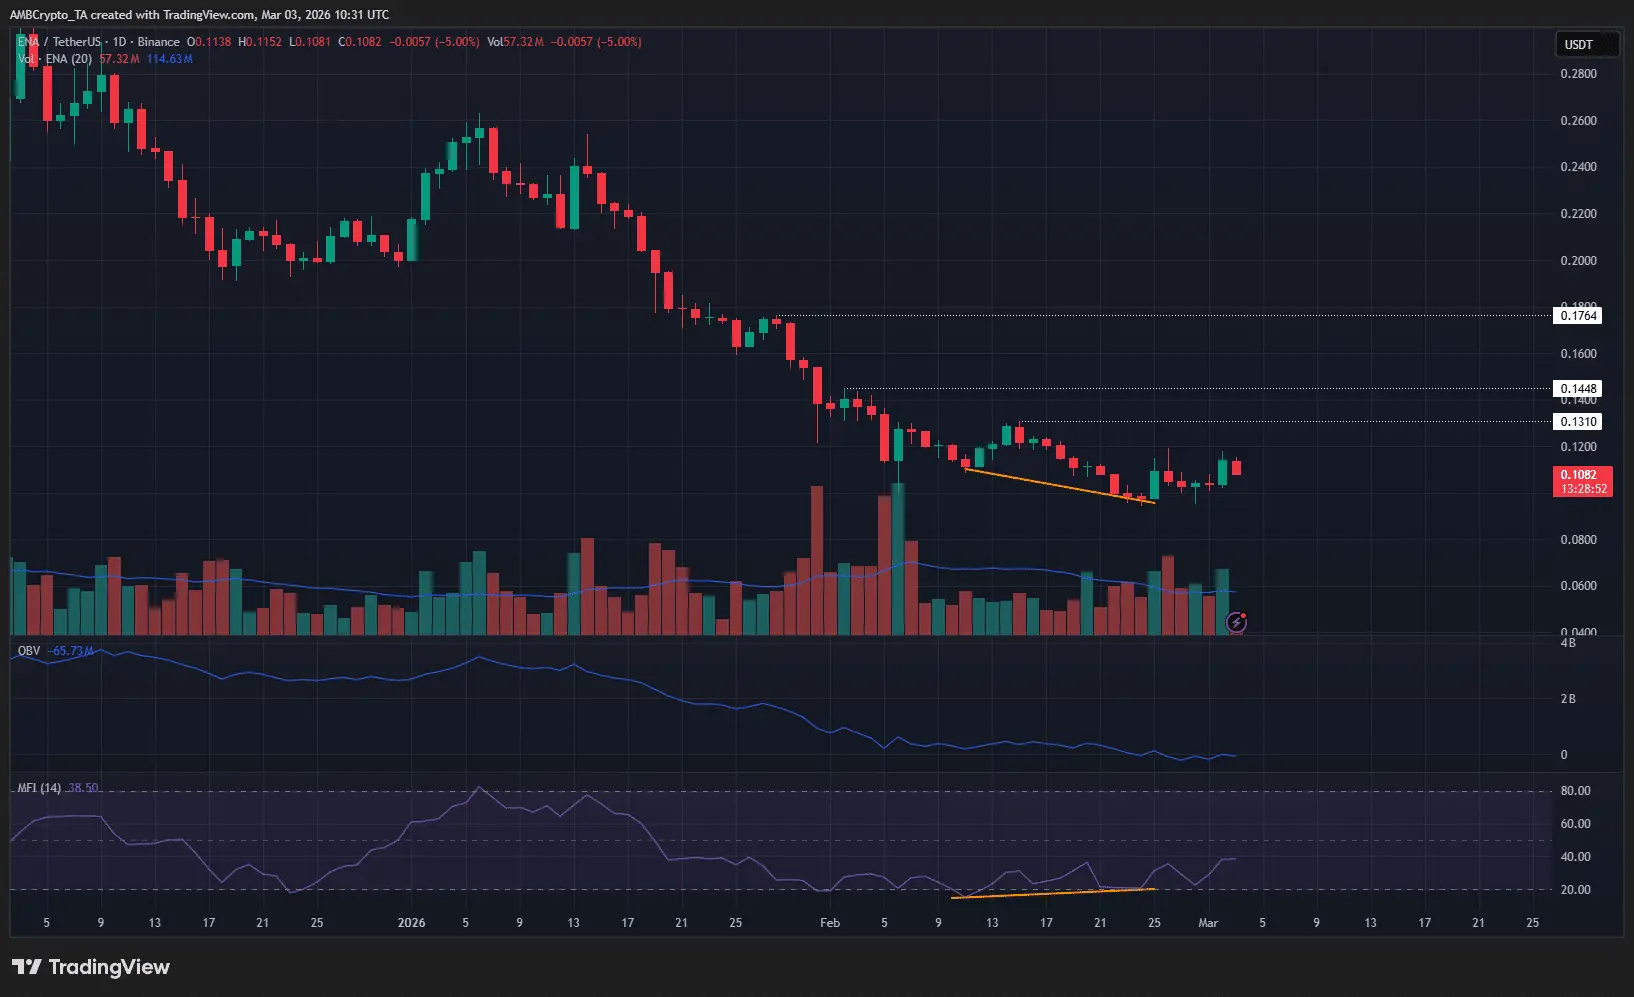 Source: TradingView However, in February, ENA’s decline began to slow. Notably, a bullish divergence signal appeared on the daily chart, with the RSI forming higher lows while the price made lower lows. This indicates that the rebound from the $0.095-$0.097 zone is likely a technical correction, temporary in nature.
The increase in trading volume, along with the rapid price rise, could be part of a natural adjustment process. Therefore, traders should exercise caution; instead of rushing to buy now, they should consider taking profits as the price recovers.
Short-term Outlook for ENA
A recent two-week liquidation heatmap analysis shows that the $0.120-$0.125 zone is a notable liquidity area, likely to attract ENA’s price in the short term. This suggests that ENA’s price could continue rising to test this liquidity cluster.
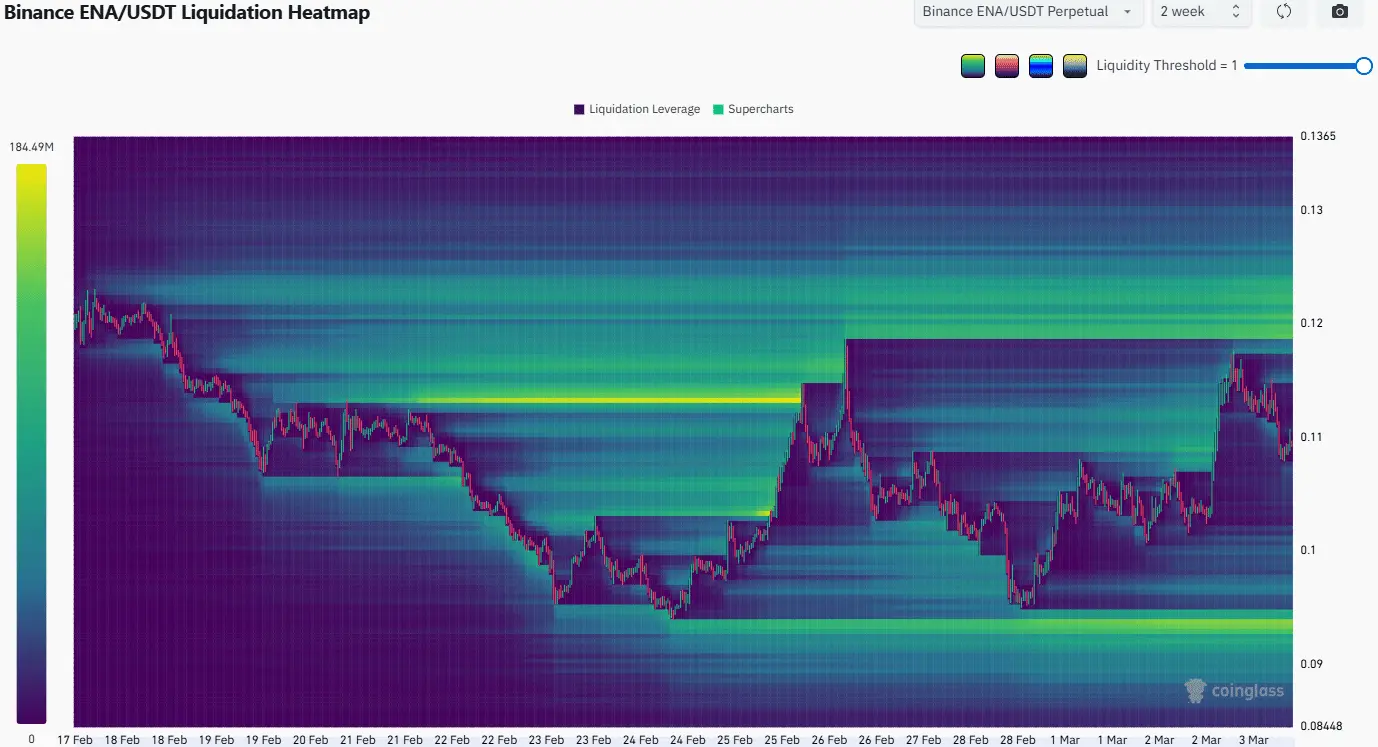 Source: CoinGlass However, it is important to note that this zone coincides with the 78.6% Fibonacci retracement level on the 4-hour chart. Although the OBV indicator is approaching local highs, this alone is not strong enough evidence to confirm an imminent trend reversal.
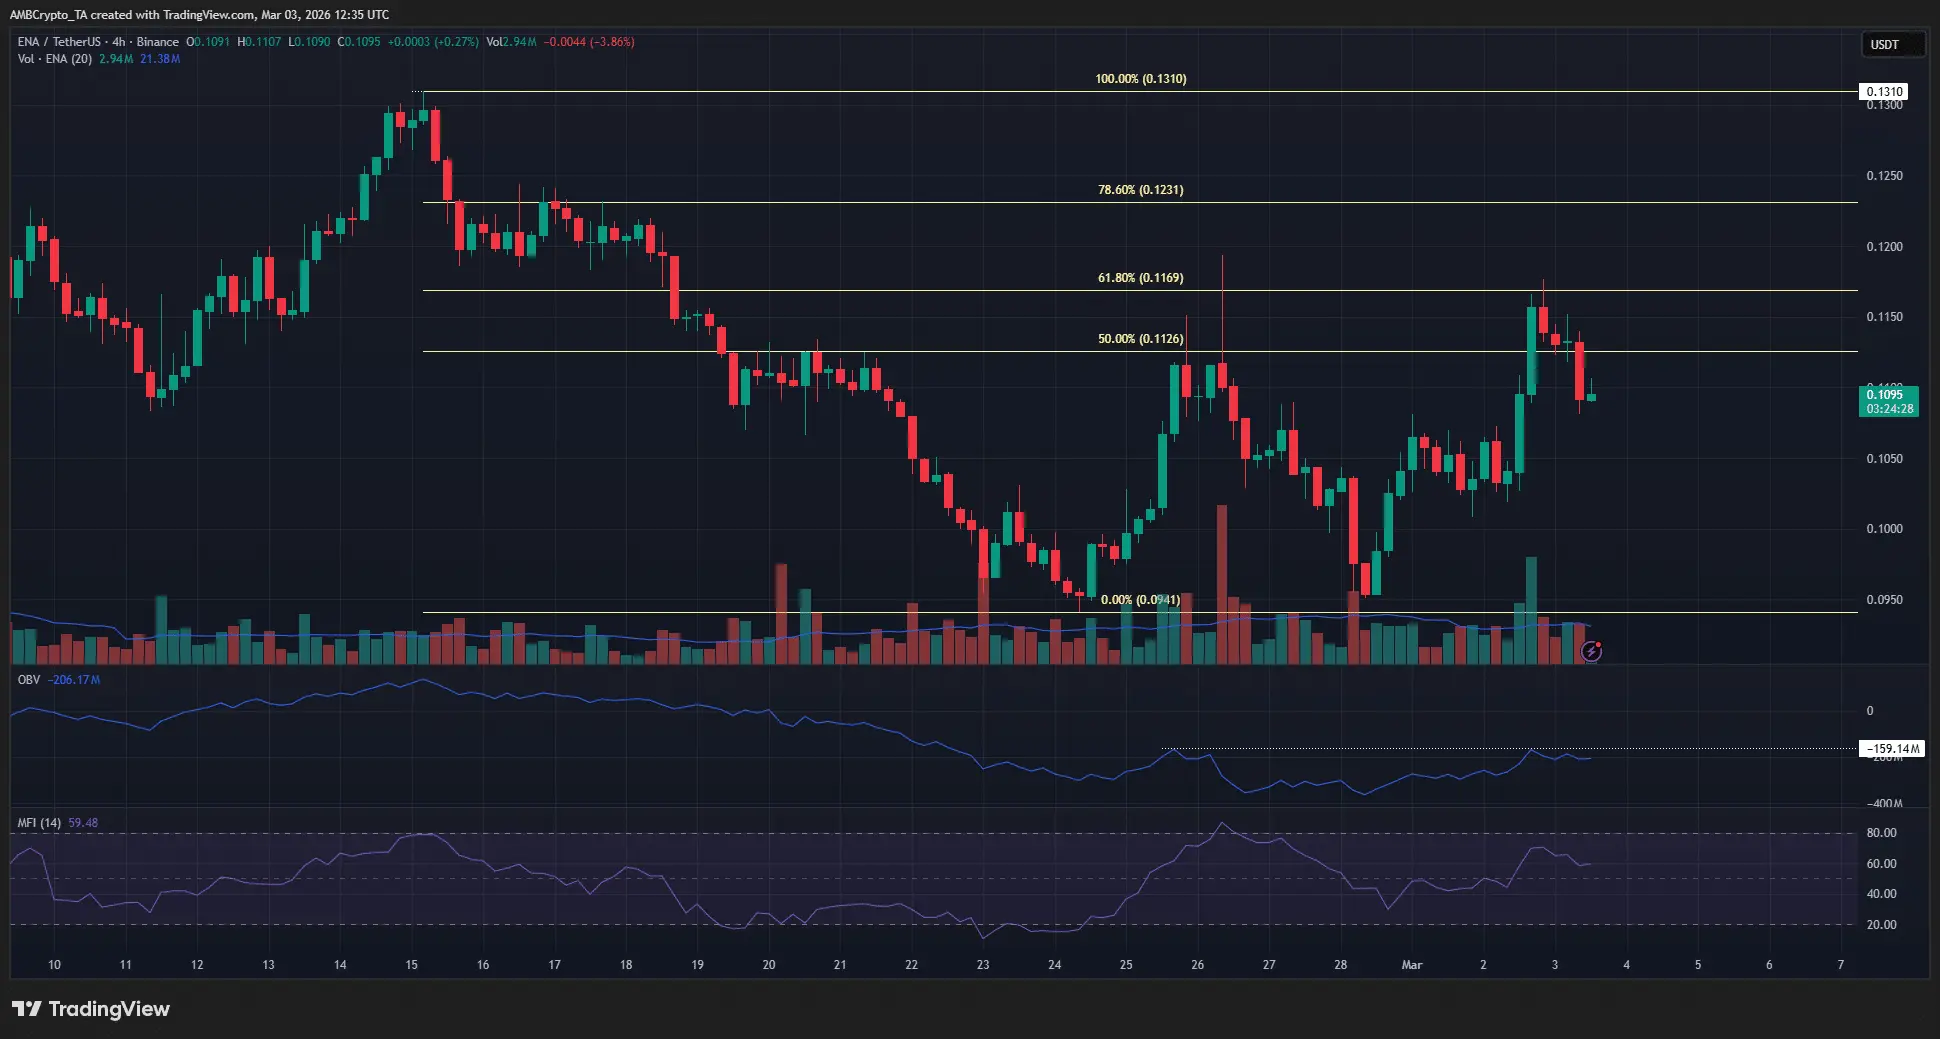 Source: TradingView Considering the broader market structure, the $0.131 level must be broken before buyers can expect a genuine trend reversal. Until then, current signals suggest any upward movement may be short-lived.
Disclaimer: The information on this page may come from third parties and does not represent the views or opinions of Gate. The content displayed on this page is for reference only and does not constitute any financial, investment, or legal advice. Gate does not guarantee the accuracy or completeness of the information and shall not be liable for any losses arising from the use of this information. Virtual asset investments carry high risks and are subject to significant price volatility. You may lose all of your invested principal. Please fully understand the relevant risks and make prudent decisions based on your own financial situation and risk tolerance. For details, please refer to
Disclaimer.
Related Articles
BTC surged to $74,000 before falling back below $69,000, with the total market capitalization evaporating approximately $110 billion.
This week, the cryptocurrency industry received positive news from Wall Street, but Bitcoin's price fell from $74,000 to $69,000, with a market cap evaporating approximately $110 billion. The strength of the US dollar and macroeconomic factors are putting pressure on risk assets. Short-term holders are taking profits, increasing selling pressure, but the US spot Bitcoin ETF recorded net inflows, indicating an improvement in the funding environment.
GateNews34m ago
Today, the cryptocurrency Fear & Greed Index dropped to 12, indicating the market is in extreme fear.
Gate News Report, March 7th, according to Alternative.me data, today the cryptocurrency fear and greed index dropped to 12, indicating the market is in a state of "extreme fear." Yesterday, the index was 18, also in the "extreme fear" zone.
GateNews50m ago
Kaspa Tops CoinMarketCap Community Sentiment With 90% Bullish Votes – Here’s Why
Kaspa’s price hasn’t had the best year. The coin is currently trading around $0.03, and on the yearly chart it’s still down roughly 60%. That kind of drop usually hurts sentiment in most crypto
CaptainAltcoin1h ago
Will XRP Hold $1.33 or Extend Toward $1.30 Before Rebound?
XRP is currently trading at $1.35, experiencing a 1.3% decline. Key support is at $1.34, while resistance is at $1.40. The price is testing around the Fibonacci levels of $1.33 and $1.30, crucial for potential upward movement or deeper decline.
CryptoNewsLand5h ago
Dogecoin Monthly Breakdown Pattern Reappears as Price Tests $0.0918
Dogecoin is currently trading at $0.09205 at a gain of 2.3, with support of above $0.08878.
As can be seen in the monthly chart, there are recurring breakdown areas that have been followed by significant expansions in price.
The short-term trading range is narrow and the immediate point o
CryptoNewsLand6h ago
Solana Nears $95 Resistance With $17B Volume Surge
Solana approaches a key resistance level near $95, with increased trading volume and open interest signaling active trader interest. The token is currently at $90.20, facing potential upward movement if it surpasses $95, but may test $85 if rejected.
CryptoFrontNews6h ago