The MOVE index, which measures the expected volatility of U.S. Treasuries, surged 21% in a single day on March 12, climbing from below 60 points in late February to 95.30 points. This reflects growing concerns about inflation driven by rising oil prices spreading to the global bond market. Meanwhile, over $2.3 billion worth of Bitcoin and Ethereum options are expiring, with derivatives market data clearly indicating the accumulation of defensive positions.
BTC and ETH Options Data: A Complete Analysis of Defensive Signals
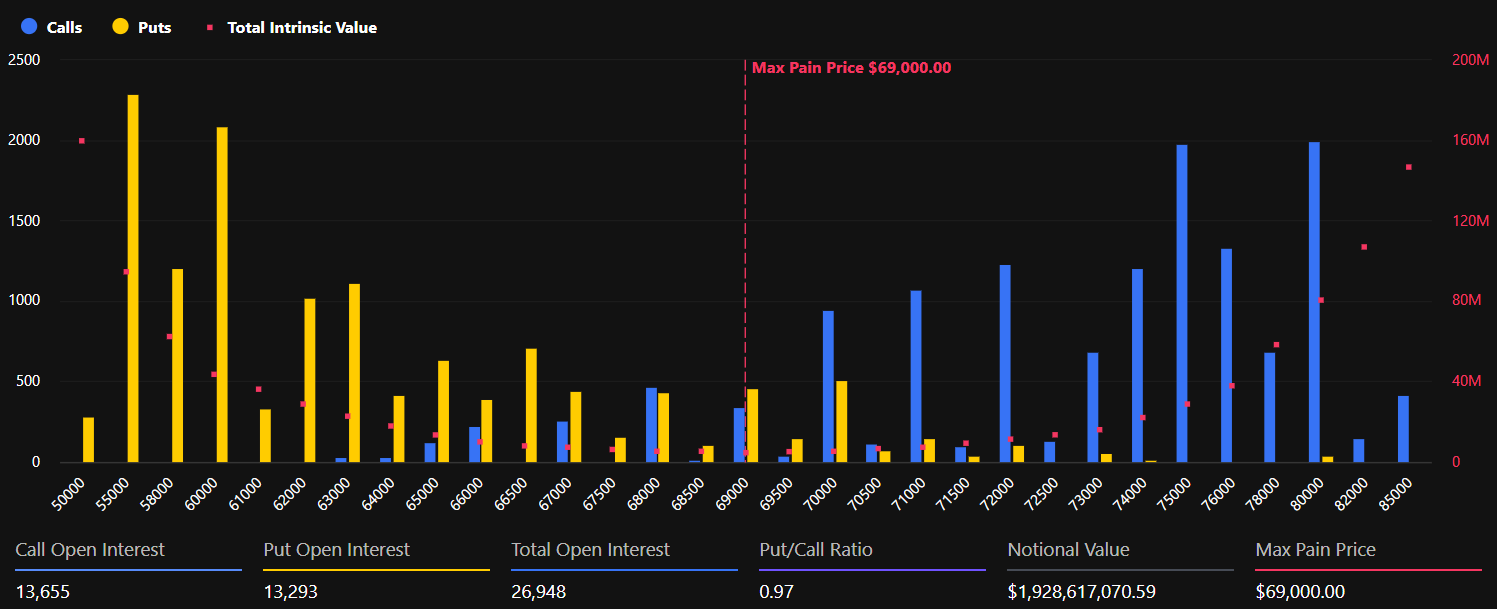
(Source: Deribit)
The options data for this expiration cycle reveals a deep-seated sentiment divergence within the crypto market. Bitcoin shows a relatively balanced but slightly conservative stance—total notional value of $1.93 billion across 26,948 contracts. The put-to-call ratio is 0.97, with the maximum downside risk at $69,000 (slightly below the current spot price of $71,500).
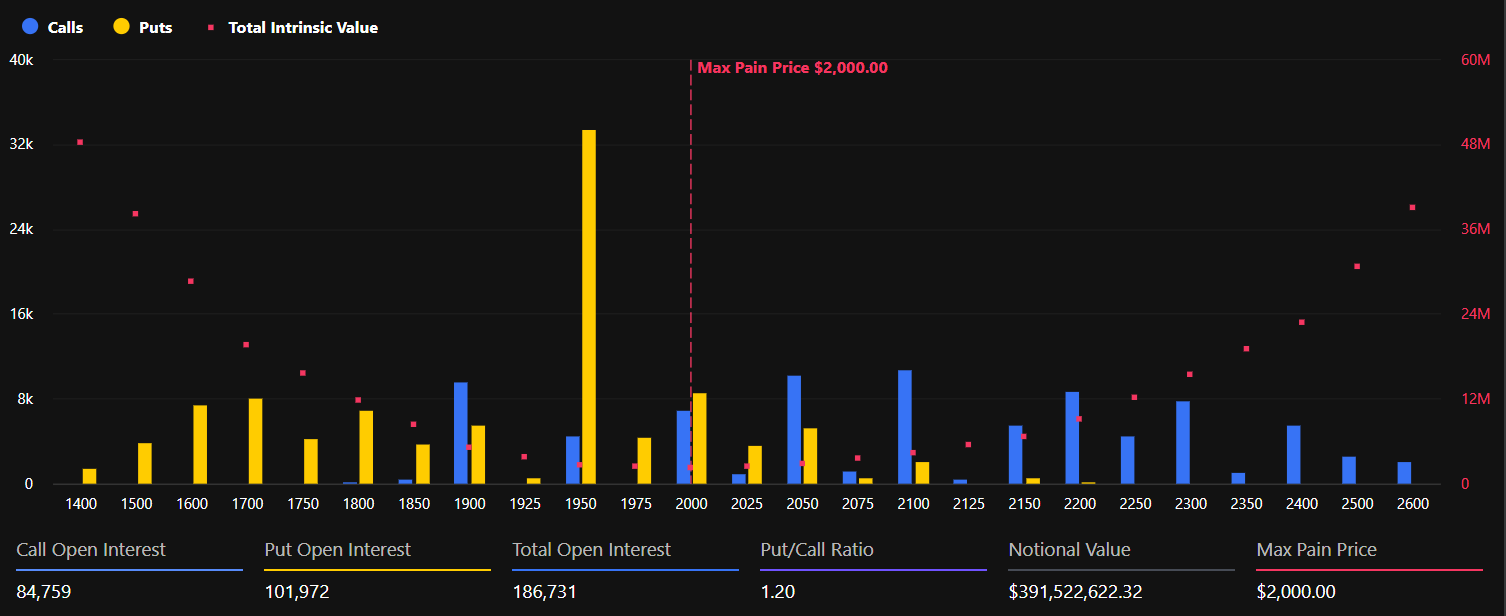
(Source: Deribit)
Ethereum’s data is even more compelling: 186,732 contracts with a notional value of $394 million. The put-to-call ratio has risen to 1.20, indicating that demand for put options significantly exceeds that for call options, reflecting genuine market hedging behavior. The maximum downside risk for Ethereum is at $2,000, about 5% below the current price of $2,110.
Notably, in the past 24 hours, open interest in crypto futures increased by 2% to $102 billion. However, stable or even negative funding rates, along with changes in trading volume, point in the same direction—this increase in open interest is driven by cautious short bets rather than renewed long confidence.
The Deep Logic Behind the MOVE Surge: Chain Reaction of Macro Risks
The MOVE index is a key macro indicator for understanding current market dynamics. U.S. Treasuries are the foundation of global financial pricing—when bond volatility spikes, it usually signals tightening financial conditions and increased liquidity preference, putting greater pressure on risk assets. The recent surge in the MOVE index is directly linked to a chain reaction triggered by oil prices returning to $100 per barrel amid tense Middle East tensions:
- Oil prices rise: reigniting inflation expectations
- Inflation expectations heat up: prompting markets to reassess the Fed’s rate cut path
- U.S. Treasury volatility spikes: MOVE index jumps 21% in a day to 95.30 points
- Financial conditions tighten: risk assets face cross-asset pressure
However, despite rising oil prices and stock market pressure, implied volatility indices for Bitcoin and Ethereum (BVIV and EVIV) remain relatively stable. Analysts at Greeks.live note that implied volatility for major maturities has fallen sharply, with monthly volatility risk premiums dropping from +2% to -9% within a day. The expanding negative premium suggests that, despite macro risks rising, traders expect future volatility to be lower than current levels.
Key Window Before the FOMC: How Long Can the Disconnect Last?
Currently, the most notable aspect of the crypto derivatives market is the apparent disconnect between Bitcoin and Ethereum implied volatility and the MOVE index. Derivatives traders have yet to incorporate significant cross-asset contagion into pricing—this “self-fulfilling prophecy” may be tested ahead of the Federal Open Market Committee (FOMC) meeting on March 17-18.
If Treasury volatility continues to rise ahead of the FOMC, this pressure could eventually spill over into the crypto market, breaking the current relative stability. Bitcoin’s spot trading range remains between $69,000 and $71,700. About $800 million worth of Bitcoin put options are concentrated at the $20,000 strike—mainly composed of deep out-of-the-money puts sold by traders (not outright bearish bets). Their presence indicates ongoing concern about extreme downside scenarios, though the positions are generally considered manageable and reflect market confidence in a mid-term bottom.
Disclaimer: The information on this page may come from third parties and does not represent the views or opinions of Gate. The content displayed on this page is for reference only and does not constitute any financial, investment, or legal advice. Gate does not guarantee the accuracy or completeness of the information and shall not be liable for any losses arising from the use of this information. Virtual asset investments carry high risks and are subject to significant price volatility. You may lose all of your invested principal. Please fully understand the relevant risks and make prudent decisions based on your own financial situation and risk tolerance. For details, please refer to
Disclaimer.