Trade
Basic
Futures
Futures
Hundreds of contracts settled in USDT or BTC
TradFi
Gold
Trade global traditional assets with USDT in one place
Options
Hot
Trade European-style vanilla options
Unified Account
Maximize your capital efficiency
Demo Trading
Futures Kickoff
Get prepared for your futures trading
Futures Events
Participate in events to win generous rewards
Demo Trading
Use virtual funds to experience risk-free trading
Earn
Launch
CandyDrop
Collect candies to earn airdrops
Launchpool
Quick staking, earn potential new tokens
HODLer Airdrop
Hold GT and get massive airdrops for free
Launchpad
Be early to the next big token project
Alpha Points
Trade on-chain assets and enjoy airdrop rewards!
Futures Points
Earn futures points and claim airdrop rewards
Investment
Simple Earn
Earn interests with idle tokens
Auto-Invest
Auto-invest on a regular basis
Dual Investment
Buy low and sell high to take profits from price fluctuations
Soft Staking
Earn rewards with flexible staking
Crypto Loan
0 Fees
Pledge one crypto to borrow another
Lending Center
One-stop lending hub
VIP Wealth Hub
Customized wealth management empowers your assets growth
Private Wealth Management
Customized asset management to grow your digital assets
Quant Fund
Top asset management team helps you profit without hassle
Staking
Stake cryptos to earn in PoS products
Smart Leverage
New
No forced liquidation before maturity, worry-free leveraged gains
GUSD Minting
Use USDT/USDC to mint GUSD for treasury-level yields
More
TradingKingGaoYuliang
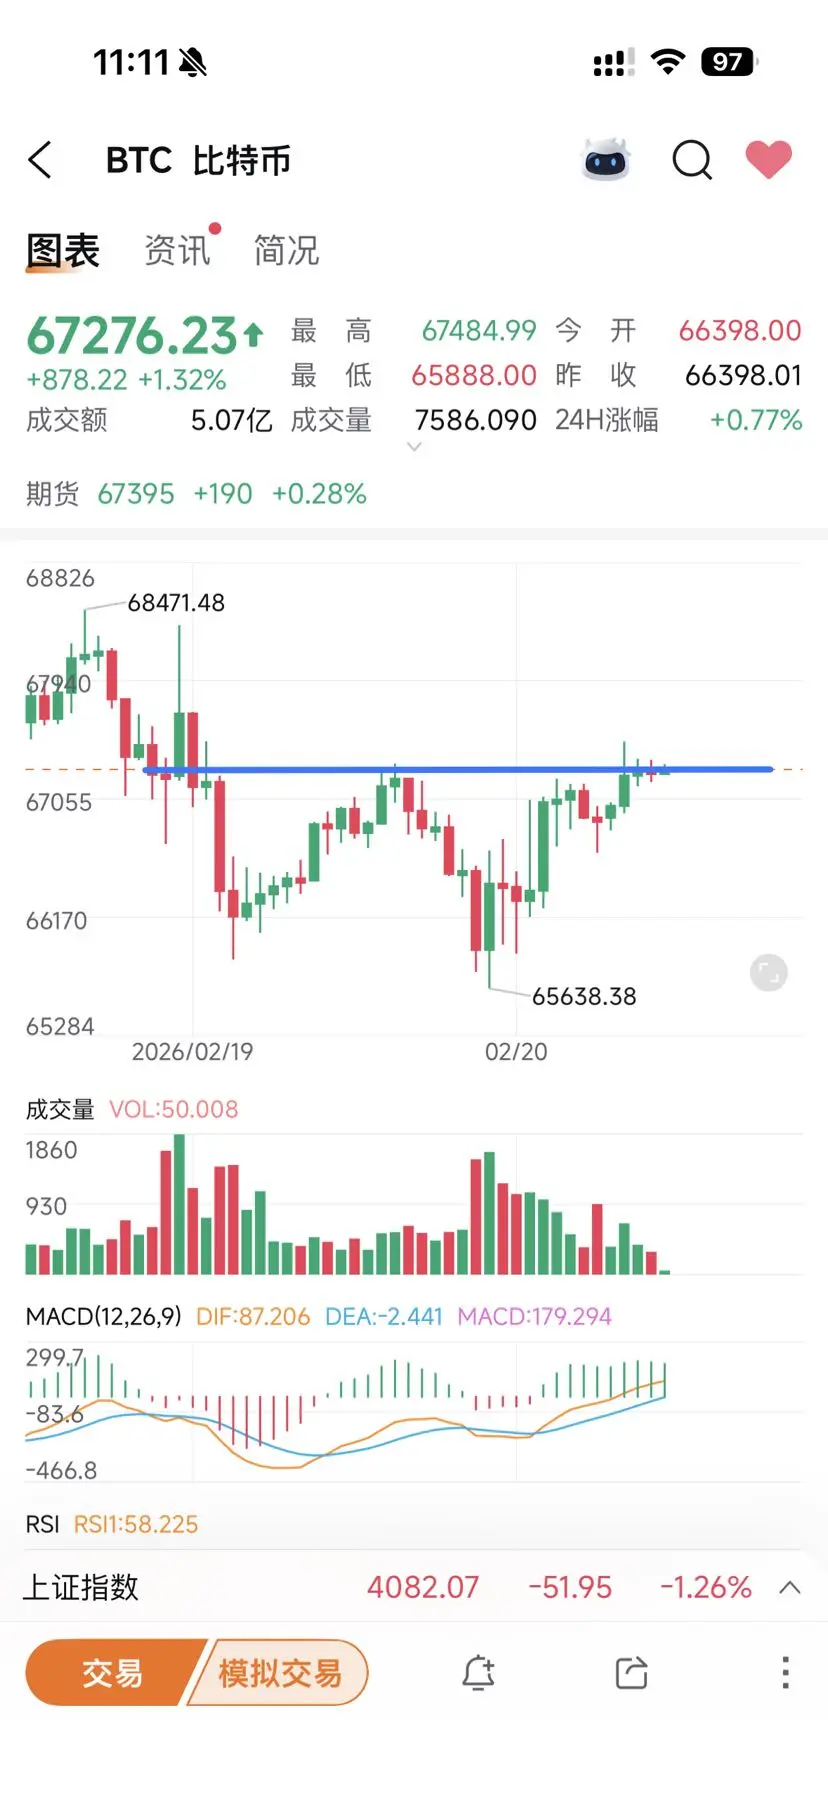
Bitcoin experienced a continued decline earlier, but today saw a good rebound. After the price broke below the previous low, the MACD showed a bullish divergence, forming a double bottom pattern. Currently, around the neckline of 67,300, a volume breakout is not very easy. Even if it breaks through the resistance at 68,000, it is quite strong. Be cautious of risks during the long-short tug-of-war when entering the market#何时是最佳入场时机
BTC0,48%
- Reward
- 2
- 2
- Repost
- Share
MelancholyBigEater :
:
So, is the point level given by the secretary for a rebound?View More
🔹 An analyst under Tom Lee: ETH may have bottomed at $1,367, with an implied 12-month upside potential of 81percetage
624
- Reward
- 1
- Comment
- Repost
- Share

- Reward
- 3
- Comment
- Repost
- Share
孔子
孔子
Created By@PiggyFromTheOcean
Listing Progress
100.00%
MC:
$69.68K
More Tokens
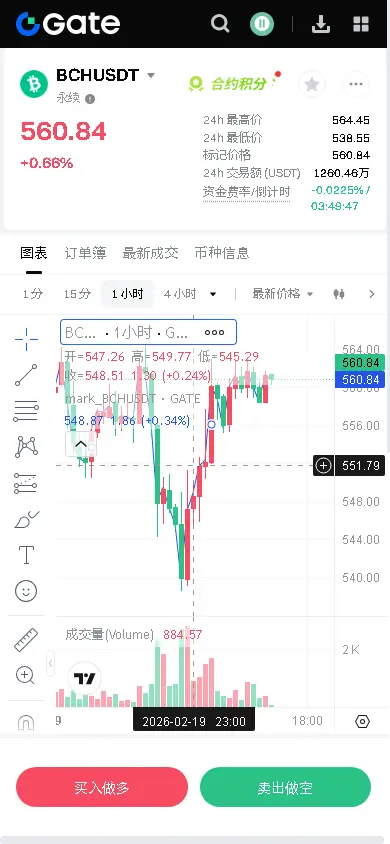
【$BCH Signal】Long | 1H holds above EMA, 4H gathers strength for breakout
$BCH The 1H timeframe is strongly consolidating above EMA20 (557.5), with the price refusing to deepen the correction. The 4H timeframe has closed with consecutive bullish candles, holding above EMA50 (550.8), showing signs of gathering strength for an upward push. The current negative funding rate (-0.0022%) and stable open interest suggest potential short squeeze. The order book shows dominant buy-side depth (imbalance of 11.44%), indicating clear support from the main players.
🎯Direction: Long (Long)
🎯Entry/Order: 56
View Original$BCH The 1H timeframe is strongly consolidating above EMA20 (557.5), with the price refusing to deepen the correction. The 4H timeframe has closed with consecutive bullish candles, holding above EMA50 (550.8), showing signs of gathering strength for an upward push. The current negative funding rate (-0.0022%) and stable open interest suggest potential short squeeze. The order book shows dominant buy-side depth (imbalance of 11.44%), indicating clear support from the main players.
🎯Direction: Long (Long)
🎯Entry/Order: 56
- Reward
- 3
- 1
- Repost
- Share
Yunna:
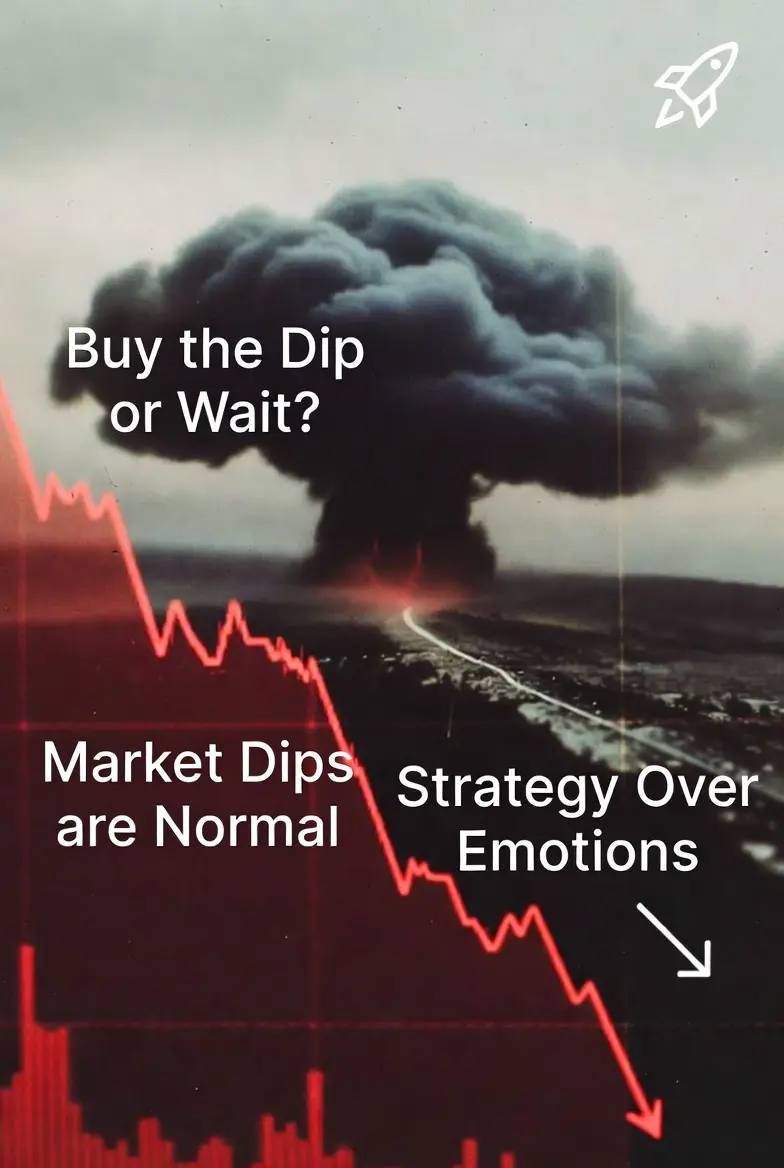
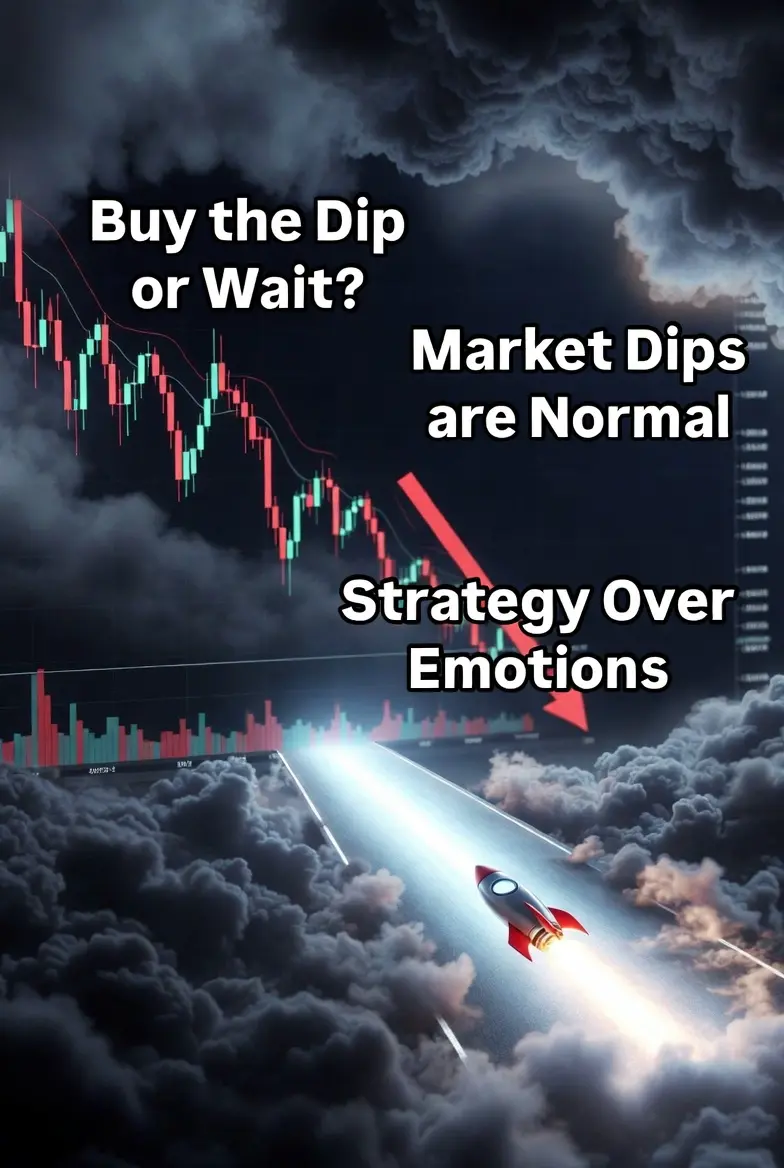
Diamond Hands 💎#BuyTheDipOrWaitNow?
The most common question in the crypto market: buy on the dip or wait? This confusion every investor faces — whether a beginner or an experienced trader. When the market is red hot, emotions run high: fear, doubt, and uncertainty. But smart decisions are made based on strategy, not emotions.
First and foremost, it’s important to understand a basic reality: market dips are normal. Crypto has historically been a volatile asset class. Price fluctuations are part of its nature, not a flaw. Those who panic at every dip often miss long-term opportunities.
However, not every dip
View OriginalThe most common question in the crypto market: buy on the dip or wait? This confusion every investor faces — whether a beginner or an experienced trader. When the market is red hot, emotions run high: fear, doubt, and uncertainty. But smart decisions are made based on strategy, not emotions.
First and foremost, it’s important to understand a basic reality: market dips are normal. Crypto has historically been a volatile asset class. Price fluctuations are part of its nature, not a flaw. Those who panic at every dip often miss long-term opportunities.
However, not every dip
- Reward
- 5
- 6
- Repost
- Share
Vortex_King:
2026 GOGOGO 👊View More
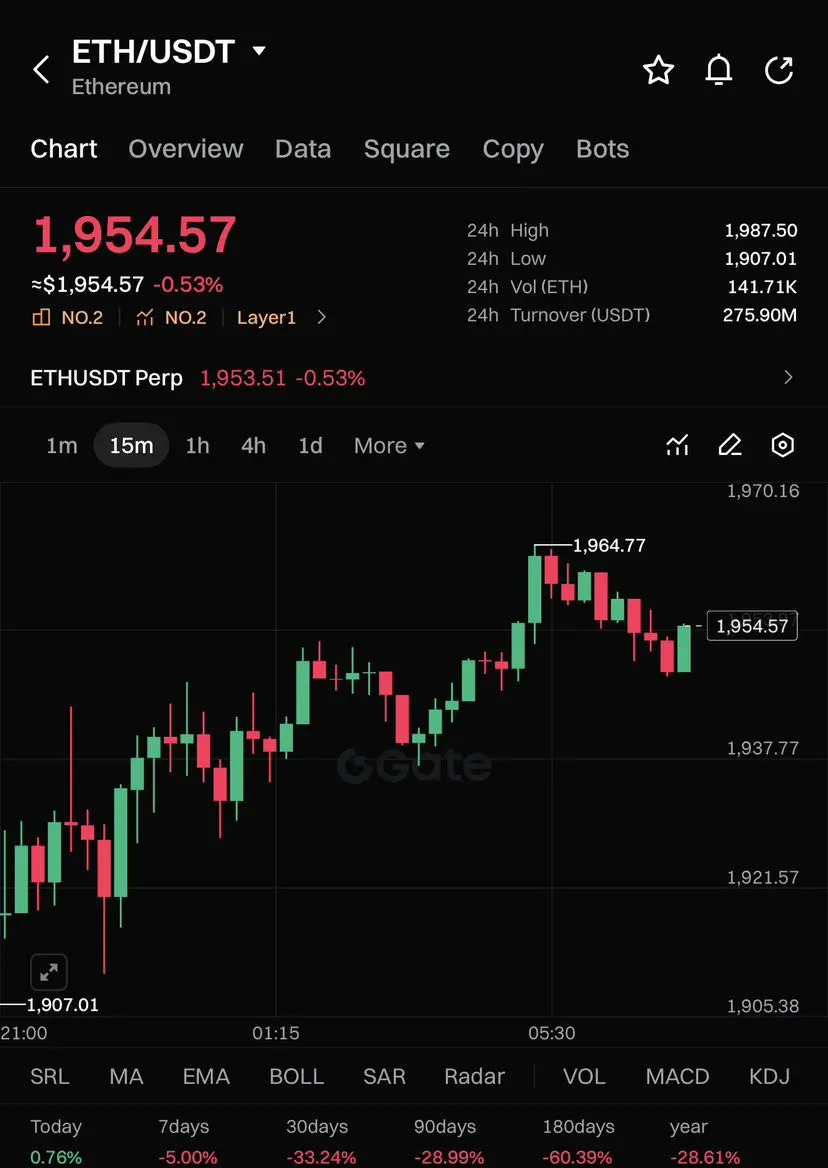
$ETH showing controlled pullback after intraday expansion.
Structure remains bullish with higher lows holding above key support zone.
EP
1,945 - 1,955
TP
TP1 1,965
TP2 1,980
TP3 2,000
SL
1,907
Liquidity was taken at 1,907 and price reacted with strong upside impulse into local highs. Current retrace looks corrective within structure, holding above demand. As long as support remains intact, upside liquidity above 1,965 stays in focus.
Let’s go $ETH
ETH-1,4%


- Reward
- 4
- 1
- Repost
- Share
Yunna:
Diamond Hands 💎Participate in horse racing betting, complete tasks to earn horse racing tickets, and enjoy a million red envelope rain daily, sharing a prize pool of 100,000 USDT at the Gate 2026 Spring Festival Celebration. https://www.gate.com/competition/year-of-horse-2026?ref_type=165&utm_cmp=7EQB9Jba&ref=VlVHBA
View Original
- Reward
- 2
- Comment
- Repost
- Share
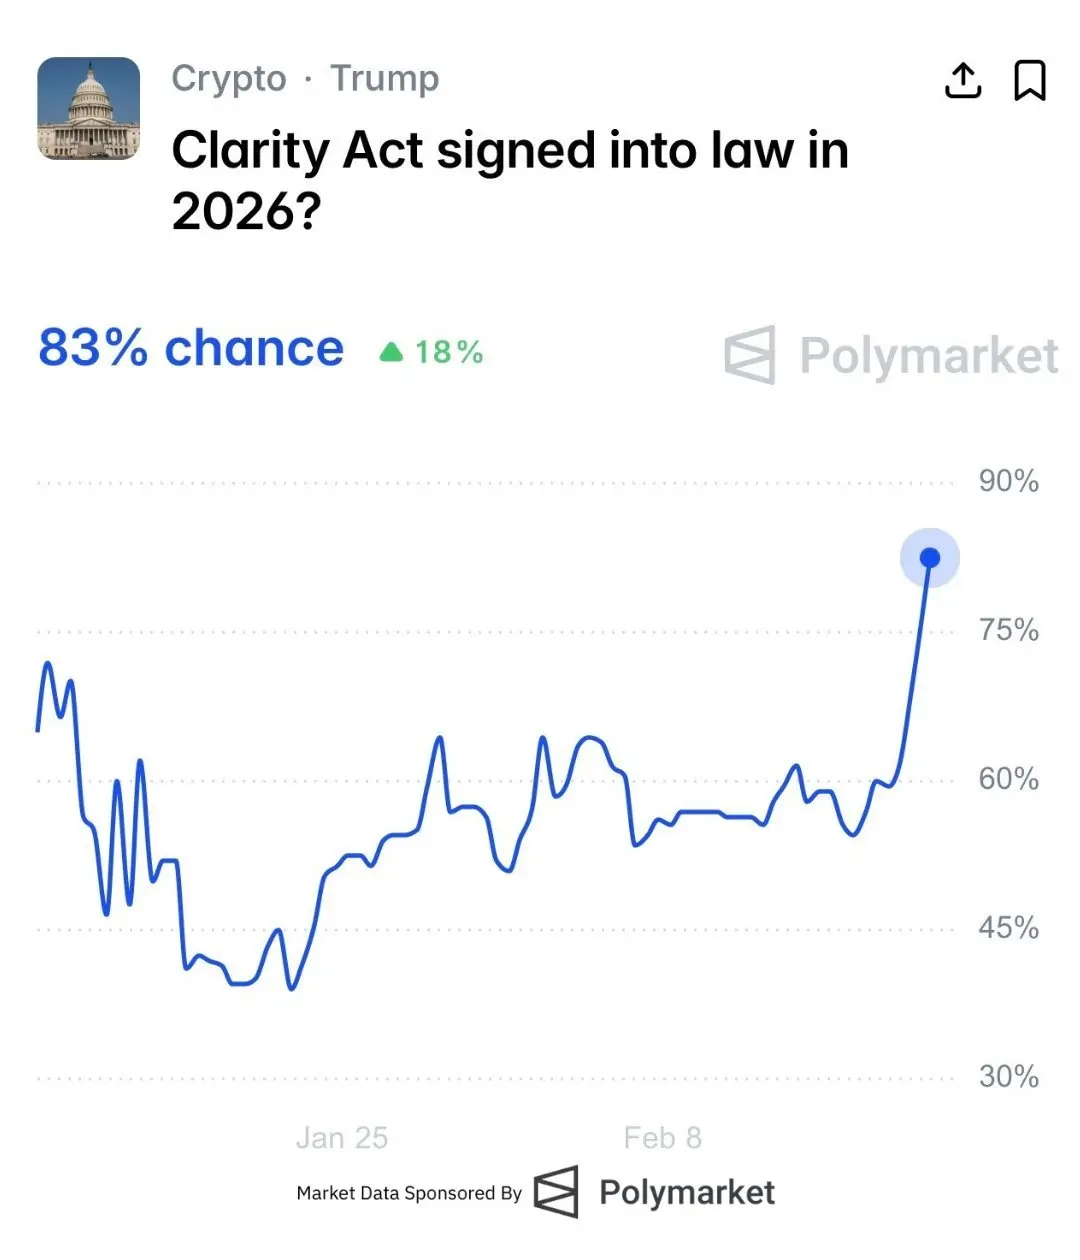
HUGE: 🇺🇸 Odds that Bitcoin and crypto market structure legislation gets signed into law this year surge to 83%.
Means That 👇👇👇
There is now a very high chance (83%) that the US government will pass clear crypto laws this year.
In simple words:
The US may finally set clear rules for Bitcoin and crypto
Less confusion, less fear of sudden bans
More confidence for big investors, banks, and institutions
Better environment for long-term crypto growth
Why this matters: Clear laws = more trust + more money entering crypto
That’s why this news is bullish for the crypto market 📈
#GateSquare$50KRed
BTC0,48%
- Reward
- like
- Comment
- Repost
- Share
- Reward
- 1
- Comment
- Repost
- Share
#CelebratingNewYearOnGateSquare #CelebratingNewYearOnGateSquare 🎆✨
The New Year isn’t just a change of calendar — it’s a reset in mindset, momentum, and market psychology.
As we step into 2026, the energy on GateSquare feels stronger than ever. A growing community, sharper strategies, and bigger ambitions. 🚀
In trading — just like in life — every new cycle brings three powerful things:
🔹 Reflection – What worked? What didn’t?
🔹 Recalibration – Adjusting strategy, managing risk smarter.
🔹 Renewed Conviction – Entering the market with clarity and confidence.
🌟 2026 Goals on GateSquare:
• S


- Reward
- 4
- 2
- Repost
- Share
neesa04:
2026 GOGOGO 👊View More
Live Trading and Learning with Chillzzz
1
- Reward
- like
- Comment
- Repost
- Share
$BTC showing steady strength above key intraday support.
Structure remains intact with buyers holding short term control above liquidity zone.
EP
67,150 - 67,350
TP
TP1 67,475
TP2 67,620
TP3 67,800
SL
66,900
Liquidity was swept below 67K and price reacted clean with strong upside push. Current consolidation under local high suggests absorption before continuation. As long as structure holds above support, momentum favors expansion toward upper liquidity.
Let’s go $BTC
BTC0,48%
- Reward
- 2
- Comment
- Repost
- Share
18
mldf
Created By@gatefunuser_2844
Listing Progress
0.00%
MC:
$2.44K
More Tokens
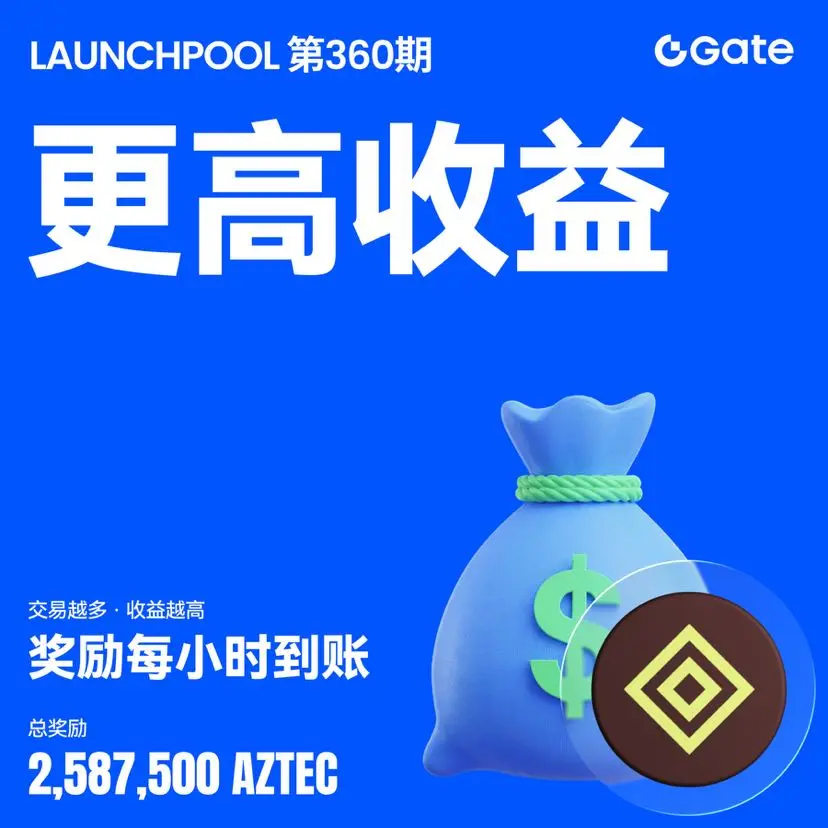
How to unlock higher rewards on $AZTEC #Launchpool?
Boost your trading volume to increase your $BTC and $USDT staking limits and maximize your $AZTEC rewards. The more you trade, the higher your earning power.
🔹 Estimated annualized return up to 153.25%
🔹 Airdrop rewards automatically credited every hour
🔹 Total pool: 2,587,500 $AZTEC
⏰ End time: February 22nd, 20:00 (UTC+8)
Stake now to secure your share:
https://www.gate.com/launchpool/AZTEC?pid=500
More details:
https://www.gate.com/article/49846
- Reward
- 2
- Comment
- Repost
- Share
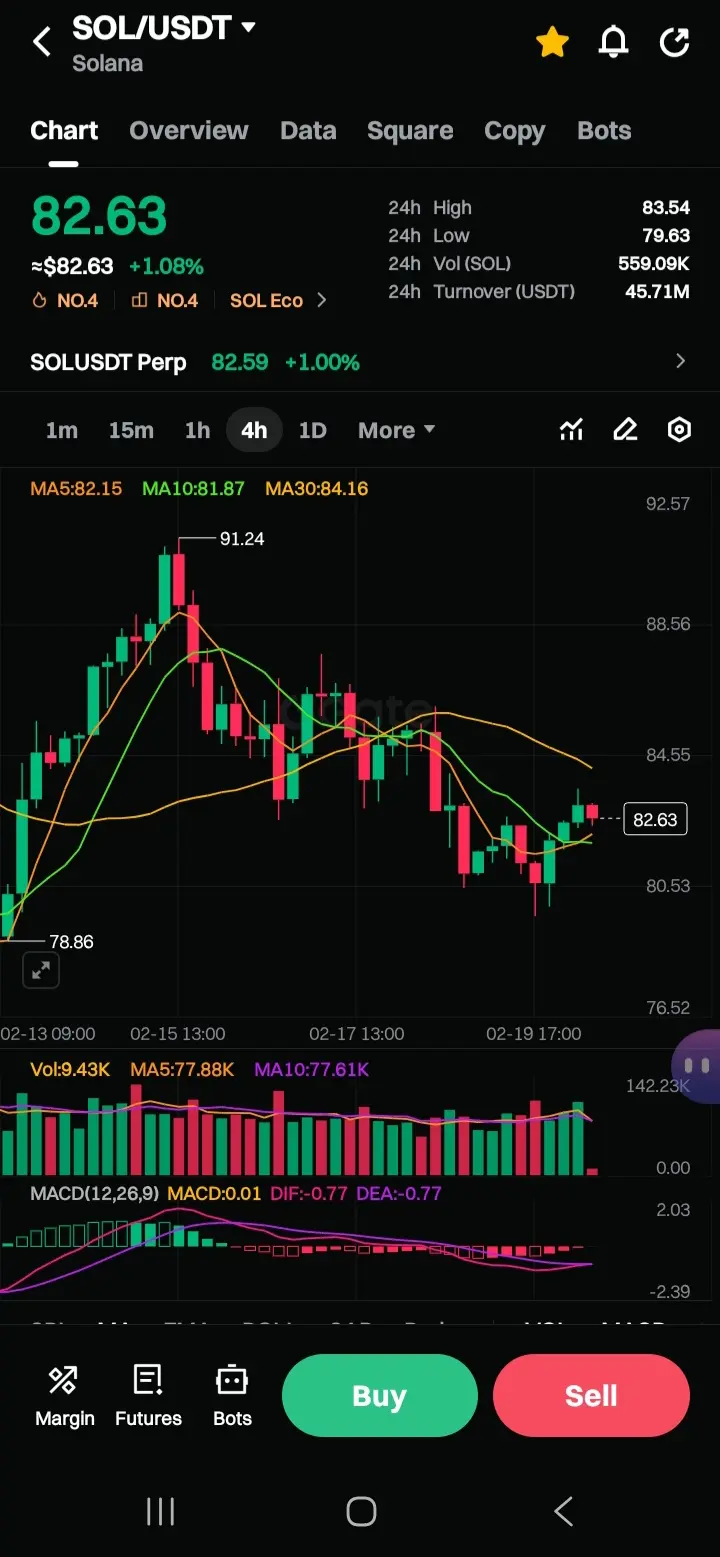
$SOL #SOLStandsStrong
This is an in-depth technical analysis of the SOL/USDT 4-hour (4h) chart provided. Based on the indicators visible (Moving Averages, Volume, and MACD), here is the breakdown of the current market structure.
1. Price Action & Trend Structure
The chart shows Solana (SOL) in a short-term corrective phase following a local peak.
Recent High: The price hit a resistance level around $91.24, followed by a series of lower highs and lower lows.
Current Support: Price found temporary footing near $79.00 - $80.00. It is currently attempting a minor bounce, trading at $82.63.
C
SOL1,09%

- Reward
- 1
- Comment
- Repost
- Share
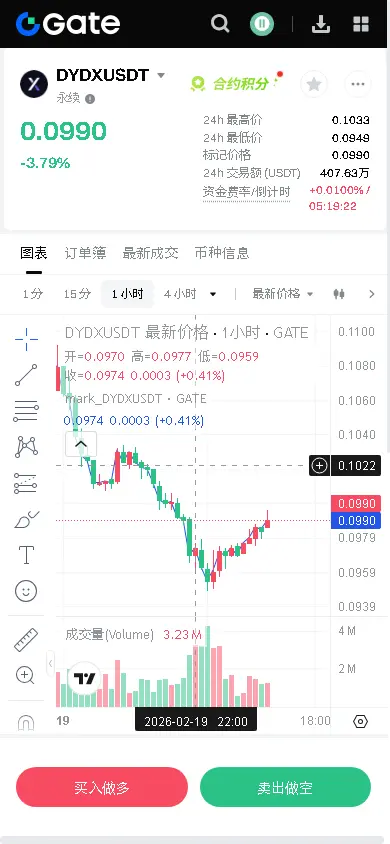
【$DYDX Signal】1H Level Rebound Brewing, Sniping Oversold Rebound Opportunity
$DYDX The 1H level has formed a short-term consolidation platform in the 0.096-0.100 range, with the price attempting to stabilize above the 1H EMA20 (0.0985). Although the 4H level remains in a downtrend, the latest candlestick closed bullish and buying volume has increased to 0.48, indicating weakening bearish momentum and a short-term oversold rebound trading opportunity. Open interest remains stable, and the price decline has not triggered large-scale deleveraging, suggesting that the main force may be defending t
View Original$DYDX The 1H level has formed a short-term consolidation platform in the 0.096-0.100 range, with the price attempting to stabilize above the 1H EMA20 (0.0985). Although the 4H level remains in a downtrend, the latest candlestick closed bullish and buying volume has increased to 0.48, indicating weakening bearish momentum and a short-term oversold rebound trading opportunity. Open interest remains stable, and the price decline has not triggered large-scale deleveraging, suggesting that the main force may be defending t
- Reward
- 3
- 1
- Repost
- Share
Yunna:
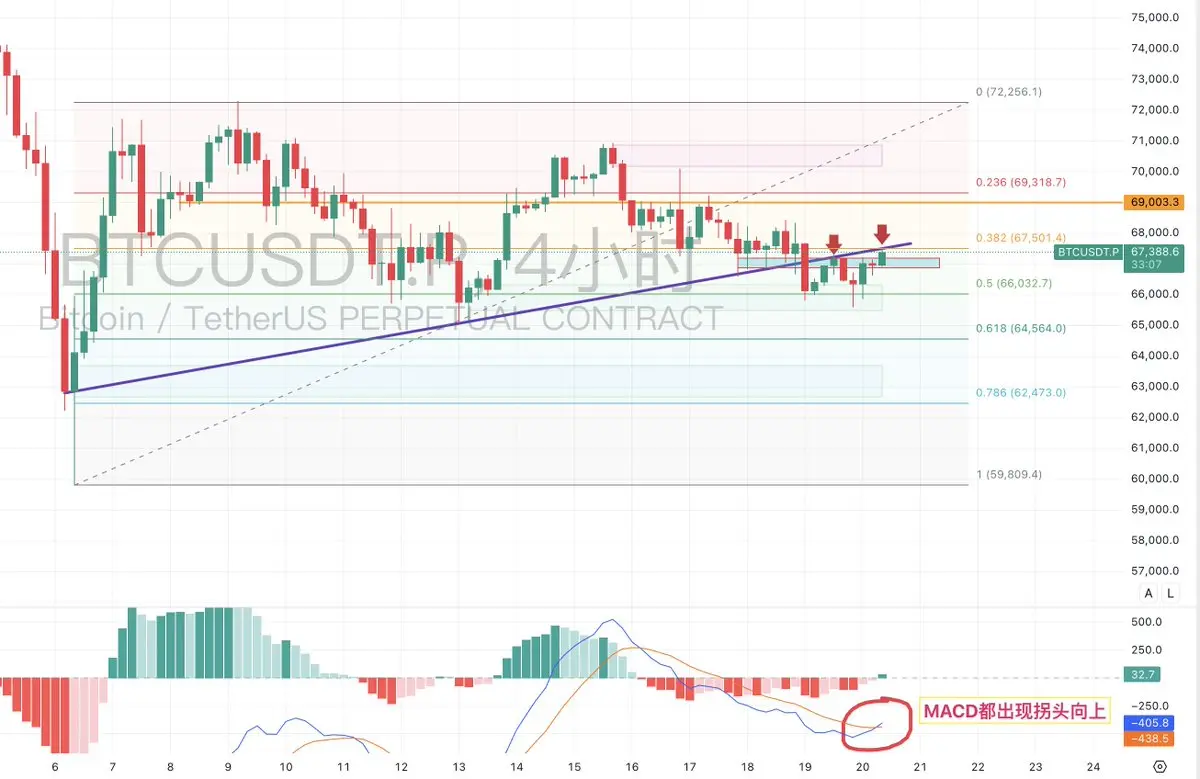
Diamond Hands 💎Market Analysis: $BTC (2026-2-20)
The four-hour ascending trendline was tested once yesterday. After breaking the new low and pulling back, it is still testing the pressure level of the trendline for the second time.
It is not recommended to short again on the second test unless the pressure is confirmed to be successful and a downward trend begins, then consider shorting, because the four-hour MACD at the bottom has turned upward, and yesterday's four-hour candle closed with a long lower shadow, indicating a bottom reversal signal📈
Summary:
The probability is high for an upward breakout📈. D
BTC0,48%
- Reward
- 2
- Comment
- Repost
- Share
Participate in horse racing betting, complete tasks to earn horse racing tickets, and enjoy a million red envelope rain daily, sharing a prize pool of 100,000 USDT at the Gate 2026 Spring Festival Celebration. https://www.gate.com/competition/year-of-horse-2026?ref_type=165&utm_cmp=7EQB9Jba&ref=AlERV18M
View Original
- Reward
- 2
- Comment
- Repost
- Share
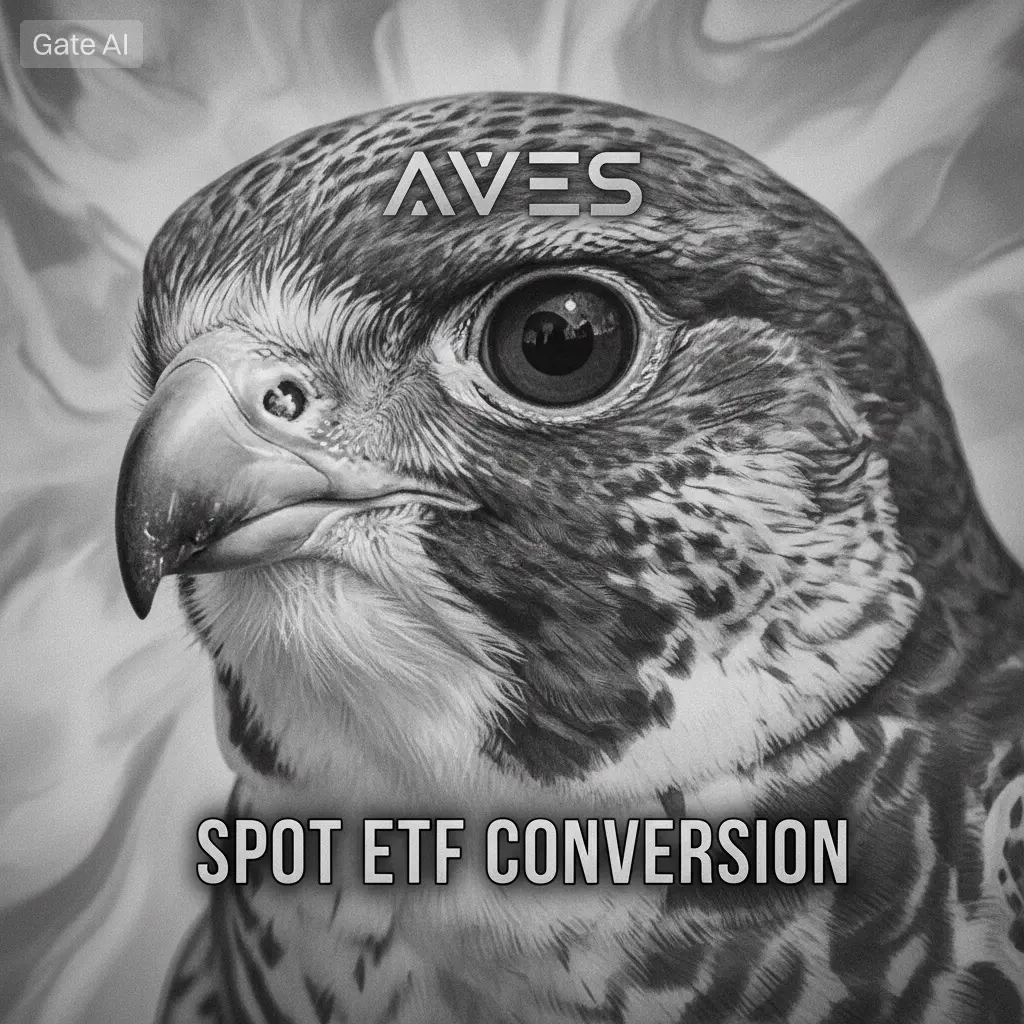
#GrayscaleEyesAVESpotETFConversion Grayscale is making headlines again with its bold move to convert the Grayscale Bitcoin Trust into a spot Bitcoin ETF. This strategic filing signals a major shift in how investors—both institutional and retail—can gain exposure to Bitcoin. Unlike the existing GBTC structure, which often traded at discounts or premiums relative to its net asset value, a spot ETF promises a more transparent, efficient, and regulated way to access the world’s largest cryptocurrency.
GBTC has long allowed investors to hold Bitcoin indirectly, offering convenience without the nee
GBTC has long allowed investors to hold Bitcoin indirectly, offering convenience without the nee
BTC0,48%
- Reward
- 8
- 21
- Repost
- Share
ShainingMoon:
To The Moon 🌕View More
Gate Square Star Copy Trading Leader Hiring Phase 2 Is LIVE 🚀
This is your moment to step up, lead, and turn your trading skills into real rewards. A massive $20,000 monthly reward pool is on the table plus serious traffic exposure.
Post on Square. Build your presence. Get rewarded.
How to Join:
1️⃣ Apply to become a Lead Trader: https://www.gate.com/copytrading/lead-trader-registration/futures
2️⃣ Register for the campaign: https://www.gate.com/questionnaire/7355
3️⃣ Join Gate Square and consistently publish content
Rewards:
🔥 First Post Bonus: $30 Copy Bonus Voucher for your first quality

- Reward
- 2
- Comment
- Repost
- Share
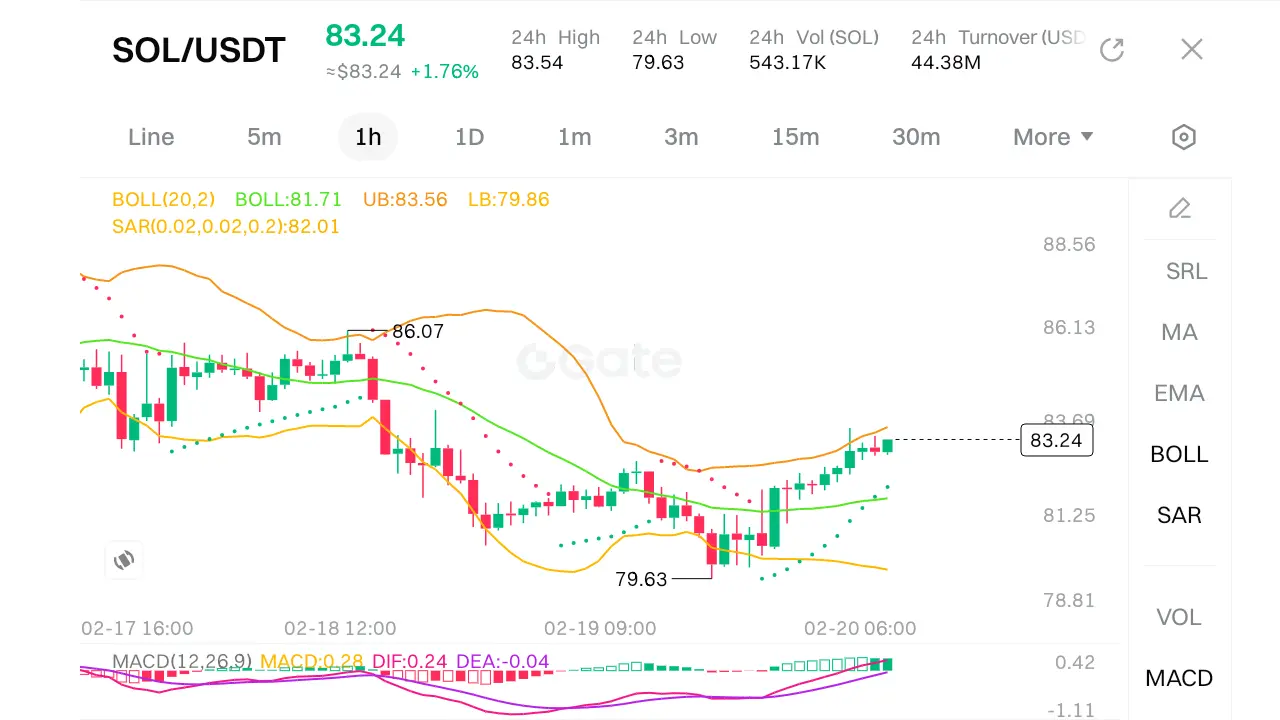
$SOL #SOLStandsStrong
SOL/USDT chart data, here's a technical analysis:
Price Action and Trend
· Current price: $83.24, up +1.76% on the day.
· Price is trading above the middle Bollinger Band ($81.71) and near the upper band ($83.56), indicating bullish momentum with a slight overbought condition.
· The SAR (Stop and Reverse) is at $82.01, below the current price, confirming an uptrend as it acts as support.
Bollinger Bands (20,2)
· Upper Band: $83.56 | Middle: $81.71 | Lower: $79.86
· Price is hugging the upper band, suggesting strong buying pressure but also potential for a pullback if res
SOL1,09%


- Reward
- 4
- 1
- Repost
- Share
Yunna:
Diamond Hands 💎Load More
Join 40M users in our growing community
⚡️ Join 40M users in the crypto craze discussion
💬 Engage with your favorite top creators
👍 See what interests you
Trending Topics
View More245.96K Popularity
871.1K Popularity
10.63M Popularity
98.85K Popularity
517.79K Popularity
Hot Gate Fun
View More- MC:$2.44KHolders:10.00%
- MC:$2.44KHolders:10.00%
- MC:$2.44KHolders:10.00%
- MC:$2.43KHolders:00.00%
- MC:$0.1Holders:10.00%
News
View MoreBalancer suspends reCLAMM-related pools due to security vulnerability reports, ensuring user fund safety
2 m
Spot gold drops about $20 in the short term, latest at $4991.15 per ounce
3 m
Three ETH Short-Position Whales Record Over $8M in Profits Amid Market Stability
7 m
Messari Report: Decibel is building a powerful and highly transparent decentralized exchange platform (DEX)
28 m
Base Co-creation: The theme for 2026 is Customer First, Building What Customers Need
29 m
Pin