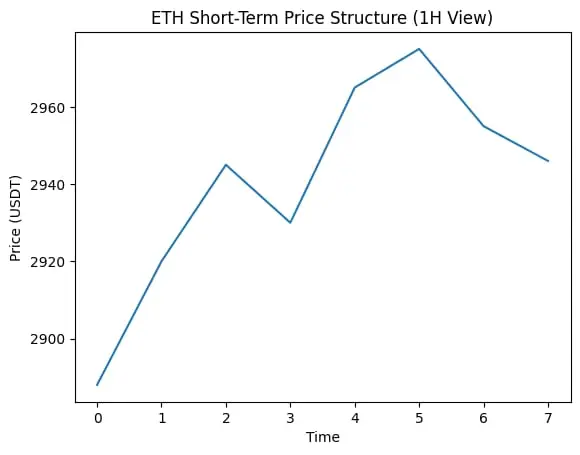
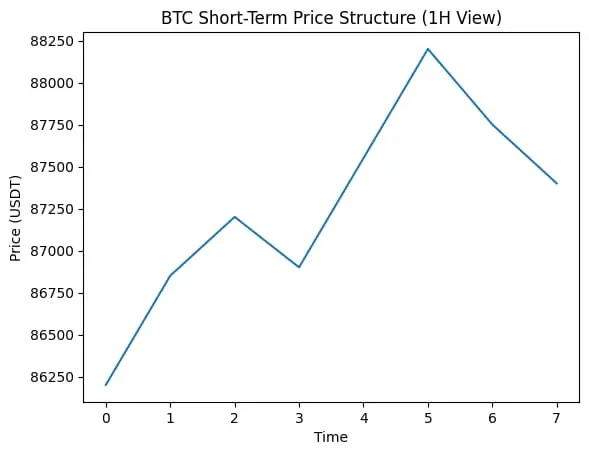
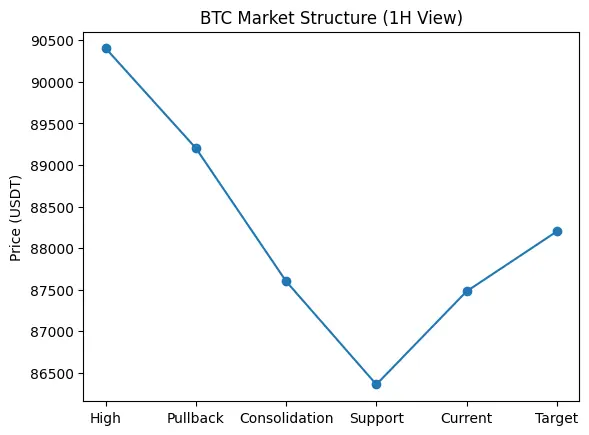
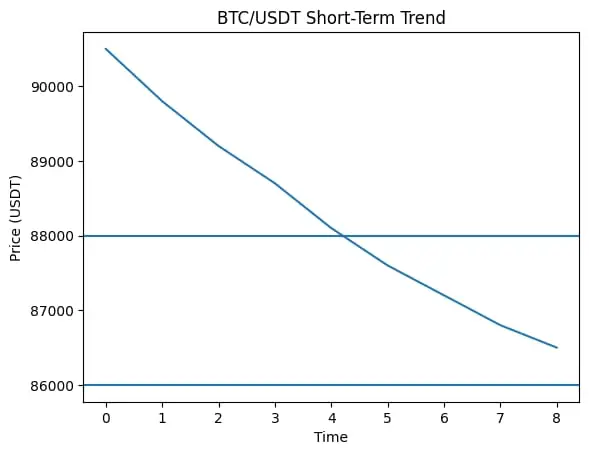
UnlimitedCryptoTrading

vip
Market Analyst
Crypto Market Researcher
Futures Trading Strategist
No content yet
Pin
KDK Launchpad Spotlight: My View on the Project & Launch Outlook
KDK is stepping into the spotlight as one of the latest Launchpad projects, and from my perspective, this is the kind of setup that usually attracts strong early attention. Launchpad tokens often benefit from two things at the same time: focused community interest and limited early supply. KDK seems positioned right in that zone.
From a project angle, KDK feels like a token designed for ecosystem participation rather than short-term hype only. When a project comes through a Launchpad, it usually means it has passed several intern
KDK0,88%
post-image
  • Reward
  • 2
  • Repost
  • Share
GoodsDragonEggvip:
Merry Christmas ⛄
View More
$PIPPIN ‌PIPPIN/USDT Market View
PIPPIN made a strong move up earlier, then cooled down. Price is now moving calmly, showing signs of balance after volatility.
1H Chart – Short-Term View
Price is consolidating near 0.50
Buyers are still defending the recent support zone
Momentum is slow, but structure remains stable
Short-term idea:
Holding above 0.47 keeps price range-bound with upside toward 0.52 – 0.54
Below 0.47, price may retest the lower base
4H Chart – Bigger Picture
After a spike to 0.56, price entered correction mode
Trend is now neutral, not bearish
Higher lows suggest accumulation,
PIPPIN-0,54%
post-image
post-image
  • Reward
  • 1
  • Repost
  • Share
CryptoSpectovip:
good information
Relive a year in crypto—riding the market highs and taking bold leaps. Every moment counts. Check your #2025GateYearEndSummary now, recap your 2025 crypto adventure with Gate, and get 20 USDT through sharing. https://www.gate.com/competition/your-year-in-review-2025?ref=VLVEBL4MAW&ref_type=126&shareUid=VVBEV1tZBQoO0O0O
post-image
  • Reward
  • Comment
  • Repost
  • Share
$ADA ‌ADA is trading around 0.357, showing signs of stabilization after a recent pullback. Price is holding above a short-term support zone, which keeps the structure neutral for now.
What the chart shows (multi-timeframe view):
1H: Small higher lows are forming. RSI is near balance, no overbought pressure.
4H: Trend is still sideways, but selling pressure looks weaker than before.
Momentum: MACD is flat and volume is steady — market is waiting for a clear move.
Possible scenarios (personal view):
Holding above 0.350 may allow a slow push toward 0.365 → 0.38.
If 0.350 fails, price could revis
ADA0,42%
post-image
  • Reward
  • Comment
  • Repost
  • Share
$DOGE ‌DOGE is trading around 0.127, showing slow and controlled movement. The price is below recent highs but still holding above a key short-term support area. No panic selling, just quiet consolidation.
Multi-timeframe view:
1H: Price is stabilizing after a pullback. RSI near mid-range shows balance, not weakness.
4H: Trend is still sideways to slightly soft, but support buyers are active near the lows.
Momentum: Volume is steady, MACD is flat — market is waiting for direction.
Possible scenarios (personal view):
Holding above 0.125 can open room toward 0.129–0.132.
If support fails, price
DOGE-2,07%
  • Reward
  • Comment
  • Repost
  • Share
$XRP ‌XRP is moving in a tight range around 1.86, showing balance between buyers and sellers. Price is hovering near short-term moving averages, which usually means the market is waiting for direction.
What I see on different timeframes:
1H: Sideways structure. RSI near mid-level shows no panic, no hype. Small pullbacks are getting bought.
4H: Price is still holding above the recent higher low zone, which keeps the short-term trend neutral to slightly positive.
Momentum: MACD is flat, volume is steady — no strong breakout yet.
Possible scenarios (personal view):
If price holds above 1.84–1.85
XRP-0,48%
post-image
  • Reward
  • Comment
  • Repost
  • Share
$ETH ‌ETH is trading around 2,946 after a strong recovery from the 2,888 low. Price is moving above short-term averages, showing buyers are still active, but momentum has slowed near the recent high.
Indicator check
Moving Averages: Price is holding around MA support → short-term trend still stable.
RSI: Sitting near the middle → balanced market, no exhaustion yet.
MACD: Slight bullish momentum, but not aggressive.
Volume: Cooling down after the push → normal consolidation phase.
Short-term outlook (1H–4H) If ETH stays above 2,930–2,940, a retest of 2,980–3,000 is possible.
A break below 2,92
ETH-0,94%
post-image
  • Reward
  • Comment
  • Repost
  • Share
$BTC ‌BTC is trading around 87.7k after a strong push up and a healthy pullback. Price is still holding above short-term moving averages, which shows buyers haven’t left the market yet.
What the indicators are saying
Moving Averages: Short MAs are slightly curling down, but structure is still bullish as long as price stays above the recent base.
RSI: Near the middle zone → no overbought pressure, room to move either side.
MACD: Momentum is cooling, not reversing. This looks more like a pause than a trend break.
Volume: Dropping after the spike → typical consolidation behavior.
Short-term idea
BTC-1,36%
post-image
  • Reward
  • Comment
  • Repost
  • Share
Relive a year in crypto—riding the market highs and taking bold leaps. Every moment counts. Check your #2025GateYearEndSummary now, recap your 2025 crypto adventure with Gate, and get 20 USDT through sharing. https://www.gate.com/competition/your-year-in-review-2025?ref=VLVEBL4MAW&ref_type=126&shareUid=VVBEV1tZBQoO0O0O
post-image
  • Reward
  • Comment
  • Repost
  • Share
$BTC ‌BTC is moving in a sideways-to-recovery phase after a sharp pullback from the 90k zone.
The drop found solid support near 86.3k, and price is now holding above it — that’s important.
What I see:
Momentum cooled, not broken
RSI is neutral → no overbought pressure
Buyers are slowly stepping back in
Volume is stable, not aggressive
Short-term view (1H–4H):
If BTC holds above 86.3k, a push toward 88.5k–90k is possible.
Rejection below 87k could lead to more consolidation before the next move.
Bigger picture:
This looks more like healthy consolidation, not trend reversal.
Patience matters he
BTC-1,36%
post-image
  • Reward
  • Comment
  • Repost
  • Share
$MON ‌Price is holding around 0.0205, staying above key short-term averages. The structure still looks healthy after the recent pullback from the local high.
What the chart is saying:
Short-term trend: Higher lows, buyers still active
Momentum: RSI is balanced, no overheating
MACD: Flat but slightly positive → slow strength building
Volume: Calm, no panic selling
Outlook by timeframe:
Short term: Sideways to mild upside, range building above 0.020
Mid term: If this base holds, a move toward 0.0218 – 0.0225 is possible
Risk zone: Loss of 0.0195 may bring a deeper pullback
This is just a person
MON0,04%
post-image
  • Reward
  • Comment
  • Repost
  • Share
$AVNT ‌AVNT just made a strong move, jumping from the 0.22 area to near 0.39. After this sharp rally, price is now cooling slightly around 0.36–0.37, which looks like a healthy pause rather than weakness.
What the chart shows:
Price is above all short-term moving averages, trend remains bullish.
RSI is high but not extreme, momentum is strong.
Volume expanded during the push, confirming real buying interest.
Important Levels:
Support: 0.33 – 0.35 (key zone to hold)
Resistance: 0.39 – 0.41 (recent high area)
Prediction (Personal View):
Short-term: Price may consolidate between 0.34 – 0.39 to c
AVNT24,05%
post-image
  • Reward
  • 3
  • Repost
  • Share
GateUser-a4f85792vip:
merycrismas
View More
$HYPE ‌HYPE is currently trading around 23.9 after failing to hold the recent high near 25.6. The price is slowly cooling down, but selling pressure doesn’t look aggressive yet.
Chart Insight:
Price is moving below short-term moving averages, showing weak momentum.
RSI stays neutral, so the market is not overbought or oversold.
Volume is steady, suggesting consolidation rather than panic selling.
Key Zones to Watch:
Support: 23.5 – important level for buyers
Resistance: 24.8 – break above this could change the trend
Prediction (Personal View):
Short-term: Price may range between 23.5 – 24.8,
HYPE3,93%
post-image
  • Reward
  • Comment
  • Repost
  • Share
$ASTER ‌ASTER is moving in a short-term downtrend after getting rejected near 0.74. Price is currently hovering around 0.67, trying to find stability after the recent dip.
What the chart is saying:
Price is trading below short-term moving averages, showing weak momentum.
RSI is neutral, so there’s room for a bounce if buyers step in.
Volume is calm, meaning sellers are slowing down.
Key Levels:
Support: 0.65 – strong zone, buyers defended it before
Resistance: 0.70 – needs a clean break to flip bullish
Prediction (Personal View):
Short-term: Price may range between 0.65 – 0.70. A bounce from
ASTER3,35%
post-image
  • Reward
  • Comment
  • Repost
  • Share
$SCOR ‌SCOR went through a heavy drop earlier, but now the chart is showing signs of recovery. Price has built a base near the recent low and is slowly moving higher. This kind of behavior usually means selling pressure is fading.
On the short timeframe, price is holding above the local bottom. RSI is around the middle zone, which suggests balance — neither strong buying nor strong selling. Momentum indicators are slowly turning positive, hinting at a possible trend shift.
Volume spikes during recent candles show renewed interest, but not aggressive chasing yet. That’s healthy for a gradual m
SCOR0,8%
post-image
  • Reward
  • Comment
  • Repost
  • Share
$NIGHT ‌NIGHT had a strong upside move earlier, followed by a sharp pullback. Right now, price is cooling down after that fast run-up, which is normal behavior after heavy momentum fades.
On the short timeframe, price is staying below short moving averages, showing sellers still have the edge. RSI is sitting near the lower zone, which suggests selling pressure is slowing and the market is trying to stabilize.
Volume has dropped compared to the peak, meaning aggressive selling is easing. This often leads to sideways movement before the next decision.
Short-term (next hours):
Sideways movement
NIGHT1,75%
post-image
  • Reward
  • Comment
  • Repost
  • Share
$DOGE ‌DOGE is moving through a calm pullback after failing to hold the recent high. On the short timeframe, price is sitting below key moving averages, which shows sellers still have control for now. Momentum is weak, but it’s not panic selling — more like a pause.
RSI is staying near the lower zone, meaning downside pressure is slowing. This often happens before price either stabilizes or tries a small bounce. Volume is also quiet, so big moves may need fresh interest.
Short-term view (hours–1 day):
Price may move sideways with small swings. If buyers step in, a mild rebound is possible. If
DOGE-2,07%
post-image
  • Reward
  • Comment
  • Repost
  • Share
$ETH ‌ETH is cooling down after a strong move and now trading below short-term moving averages on the 1H chart. Momentum looks weak, but selling pressure is not aggressive.
Indicator snapshot:
RSI is near the lower zone → downside may slow
MACD still bearish, but momentum is fading
Volume is steady → no panic move yet
Key zones to watch:
Support: 2,880 – 2,900
Resistance: 3,000 – 3,050
Outlook (personal view):
Short term: range or small bounce from support
If 2.9k holds, recovery toward 3k is possible
Losing support may bring another slow dip
This is just a personal market view, not financial
ETH-0,94%
post-image
  • Reward
  • Comment
  • Repost
  • Share
$BTC ‌BTC is moving in a short-term pullback after failing to hold the recent high. On the 1H timeframe, price is trading below key moving averages, showing weak momentum for now.
What indicators suggest:
RSI is near oversold → selling pressure is slowing
MACD still bearish, but momentum loss is visible
Volume is decreasing → panic selling is not strong
Levels to watch:
Support zone: 85.8k – 86.0k
Resistance zone: 88.0k – 89.0k
Outlook (personal view):
Short term: possible sideways move or small bounce from support
Mid term: trend direction will be clearer after reclaiming 88k
If support brea
BTC-1,36%
post-image
  • Reward
  • Comment
  • Repost
  • Share
Relive a year in crypto—riding the market highs and taking bold leaps. Every moment counts. Check your #2025GateYearEndSummary now, recap your 2025 crypto adventure with Gate, and get 20 USDT through sharing. https://www.gate.com/competition/your-year-in-review-2025?ref=VLVEBL4MAW&ref_type=126&shareUid=VVBEV1tZBQoO0O0O
post-image
  • Reward
  • Comment
  • Repost
  • Share
$BEAT ‌BEAT showed a strong upward move, followed by a clear rejection from the recent high. The current price action looks like a normal correction after expansion, not a breakdown.
On the short-term timeframe, price is consolidating after the pullback, suggesting the market is trying to find balance. Momentum indicators have cooled down, which often happens before the next decision move.
From a multi-timeframe view:
Lower timeframe: Sideways to slow recovery possible
Mid timeframe: Trend remains constructive if support holds
Near-term expectation: Range movement first, then a reaction move
BEAT-2,29%
post-image
  • Reward
  • Comment
  • Repost
  • Share
  • Pin

Trade Crypto Anywhere Anytime
qrCode
Scan to download Gate App
Community
  • 简体中文
  • English
  • Tiếng Việt
  • 繁體中文
  • Español
  • Русский
  • Français (Afrique)
  • Português (Portugal)
  • Bahasa Indonesia
  • 日本語
  • بالعربية
  • Українська
  • Português (Brasil)