XRP Can Stage a Rally at This Level, Despite 17% Weekly Crash (Ripple Price Analysis)
CryptoPotato
Ripple’s price has experienced a notable downturn owing to the recent rapid drop in Bitcoin’s value. However, amidst this scenario, a glimmer of hope emerges for a potential short-term interruption in the prevailing downtrend.
This optimism arises as the price approaches a robust support zone marked by the 200-day moving average.
Technical Analysis
By Shayan
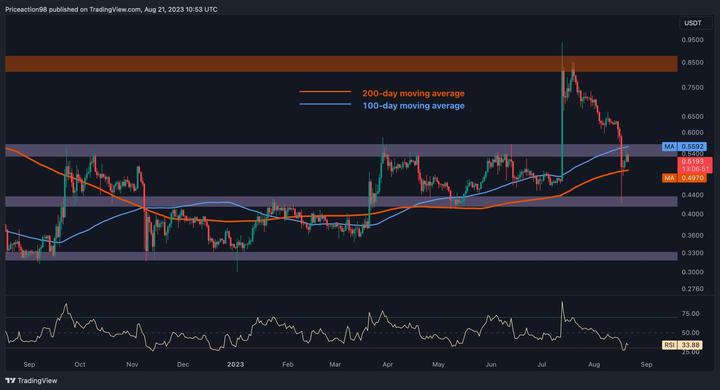
The heightened selling pressure and bearish sentiment in the market, which has led to a substantial decrease in Ripple’s price, is apparent. Consequently, this downturn has effectively halted the previous bullish momentum and resulted in an extended rejection. This decline has pushed the price below both the 100-day and 200-day moving averages, positioned at $0.55 and $0.49, respectively.
However, upon reaching the significant support level at approximately $0.42, the price encountered noteworthy support, leading to a rebound that immediately propelled it above the 200-day moving average.
This particular support zone carries the potential to arrest further downward movement and potentially facilitate a brief consolidation phase.
Notably, the price is currently confined within a narrow range delineated by the 100-day and 200-day moving averages. A breakout from this range could potentially serve as an indicator of Ripple’s imminent trajectory. This breakout might signify either a corrective phase before a continuation of the downtrend or a reversal targeting the resistance level at $0.85.
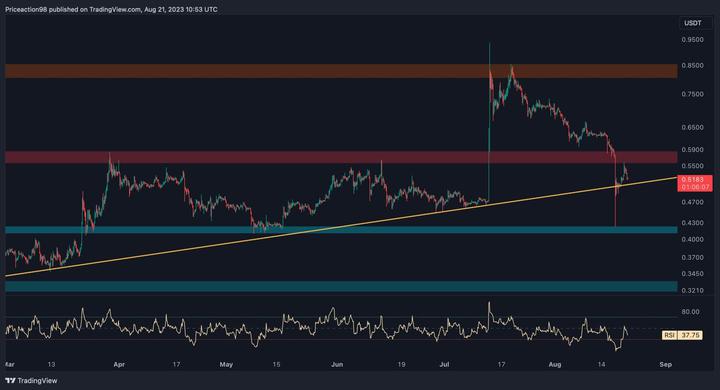
Shifting the focus to the 4-hour chart reveals that the price had been undergoing an extended uptrend, reaching a yearly peak of around $0.95. Nevertheless, a recent decline ed a retracement back to a multi-month uptrend, which has consistently provided robust support to the price movement.
While the cryptocurrency garnered support upon reaching this pivotal uptrend line and experienced a slight rebound, the prospect of another downward movement remains plausible.
Such a scenario could potentially drive the price beneath this critical dynamic support level. In such a case, a subsequent drop toward the static support at $0.42 becomes increasingly likely.
On the flip side, if buyers effectively sustain the price in the vicinity of this pivotal trendline, it could catalyze a fresh surge toward the $0.85 threshold. Such a development would inject heightened volatility into the market. Regardless of the outcome, monitoring price fluctuations is essential, as the interplay between these support and resistance levels will play a decisive role in shaping the immediate trajectory of Ripple’s price action.
免责声明:本页面信息可能来自第三方,不代表 Gate 的观点或意见。页面显示的内容仅供参考,不构成任何财务、投资或法律建议。Gate 对信息的准确性、完整性不作保证,对因使用本信息而产生的任何损失不承担责任。虚拟资产投资属高风险行为,价格波动剧烈,您可能损失全部投资本金。请充分了解相关风险,并根据自身财务状况和风险承受能力谨慎决策。具体内容详见声明。
评论
0/400
暂无评论