Bitcoin traded at $70,795 on March 14, 2026, with a market capitalization of $1.41 trillion and 24-hour trading volume of $49.48 billion. The cryptocurrency moved within an intraday range between $70,416 and $73,838 while technical indicators across major timeframes reflected a neutral market structure.
Bitcoin Chart Outlook
On the daily chart, bitcoin continues to trade inside a consolidation range following a rejection near the $74,000 resistance zone. Current price levels around $70,467 on Bitstamp place the asset in the middle of a broader visible trading band between approximately $63,000 and $77,500.
Market structure reflects sideways movement with declining volatility after the rejection near recent highs. Key resistance remains between $73,800 and $74,000, while mid-range resistance sits near $71,200. Support is identified around $69,500, with stronger structural support near $66,000. As long as the price remains above the $69,500 level, the broader bias remains neutral to slightly upward within the existing range.
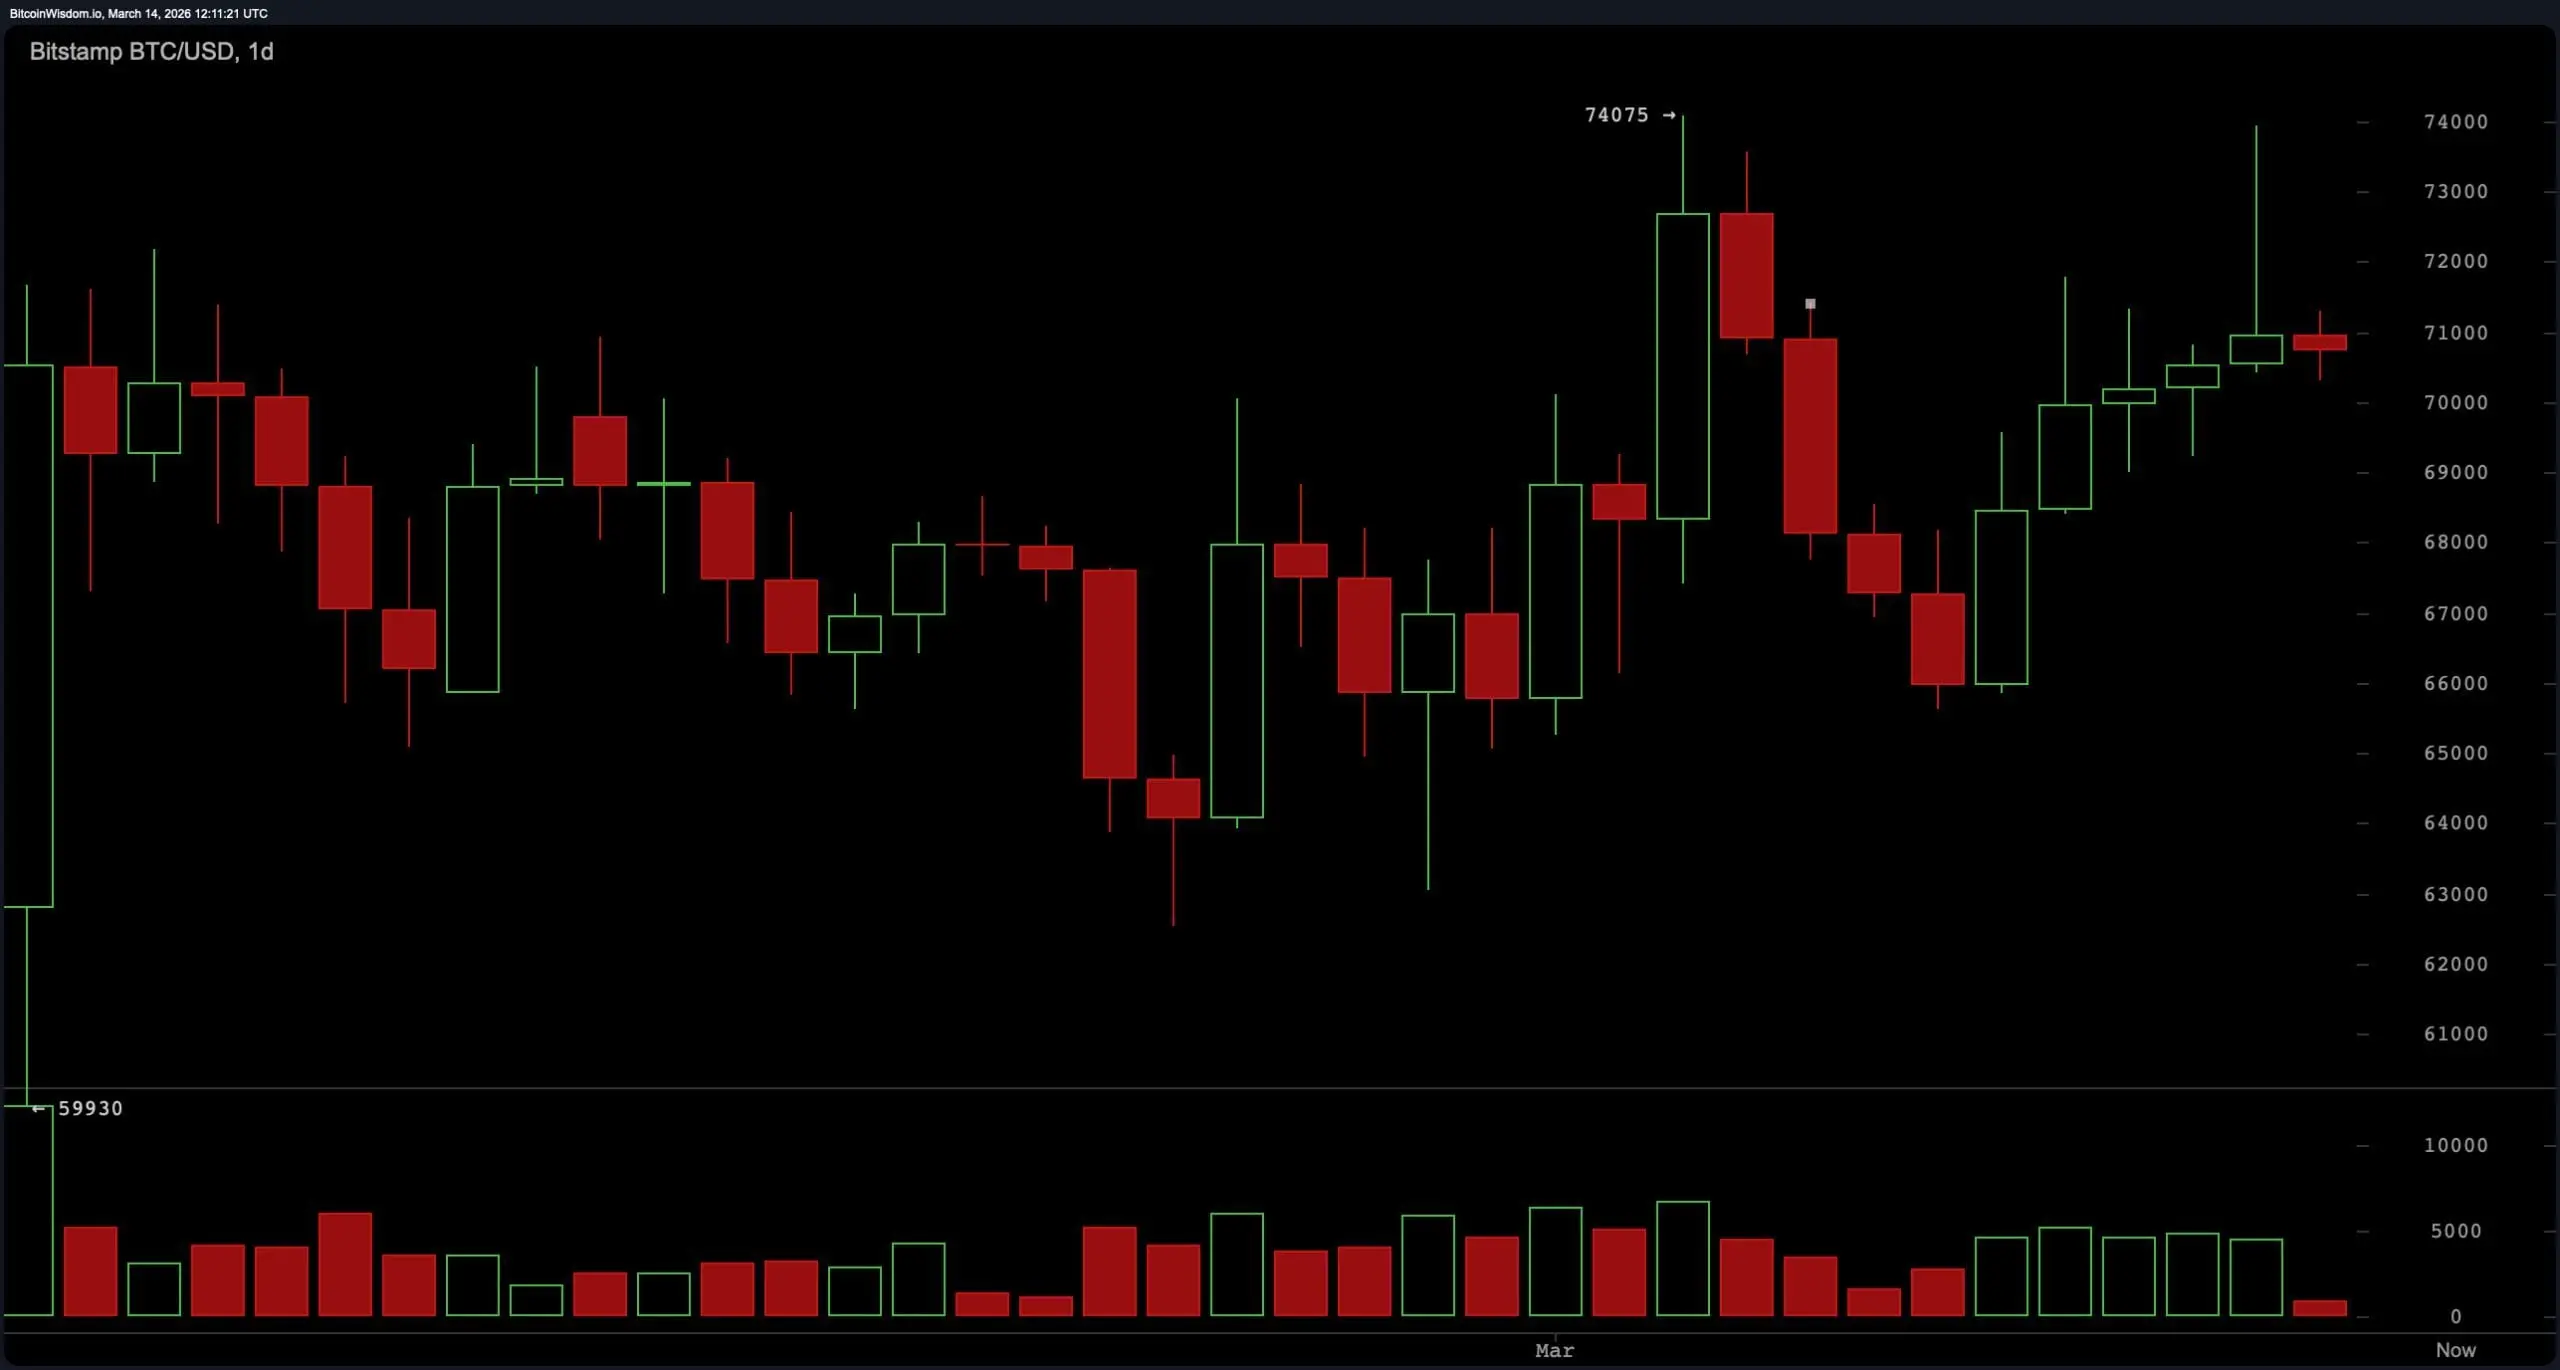 BTC/USD 1-day chart via Bitstamp on March 14, 2026.
The four-hour bitcoin chart shows continued sideways consolidation supported by a sequence of higher lows. Previous swing levels progressed from approximately $65,600 to $69,000 and then to near $70,000, suggesting gradual upward pressure beneath resistance. Price has repeatedly encountered resistance between $71,500 and $72,000, creating a compression pattern as volatility narrows. This type of price structure often precedes expansion once resistance or support is decisively breached. The current compression below resistance indicates that a move beyond this zone could determine the next directional move of roughly $3,000 to $5,000.
BTC/USD 1-day chart via Bitstamp on March 14, 2026.
The four-hour bitcoin chart shows continued sideways consolidation supported by a sequence of higher lows. Previous swing levels progressed from approximately $65,600 to $69,000 and then to near $70,000, suggesting gradual upward pressure beneath resistance. Price has repeatedly encountered resistance between $71,500 and $72,000, creating a compression pattern as volatility narrows. This type of price structure often precedes expansion once resistance or support is decisively breached. The current compression below resistance indicates that a move beyond this zone could determine the next directional move of roughly $3,000 to $5,000.
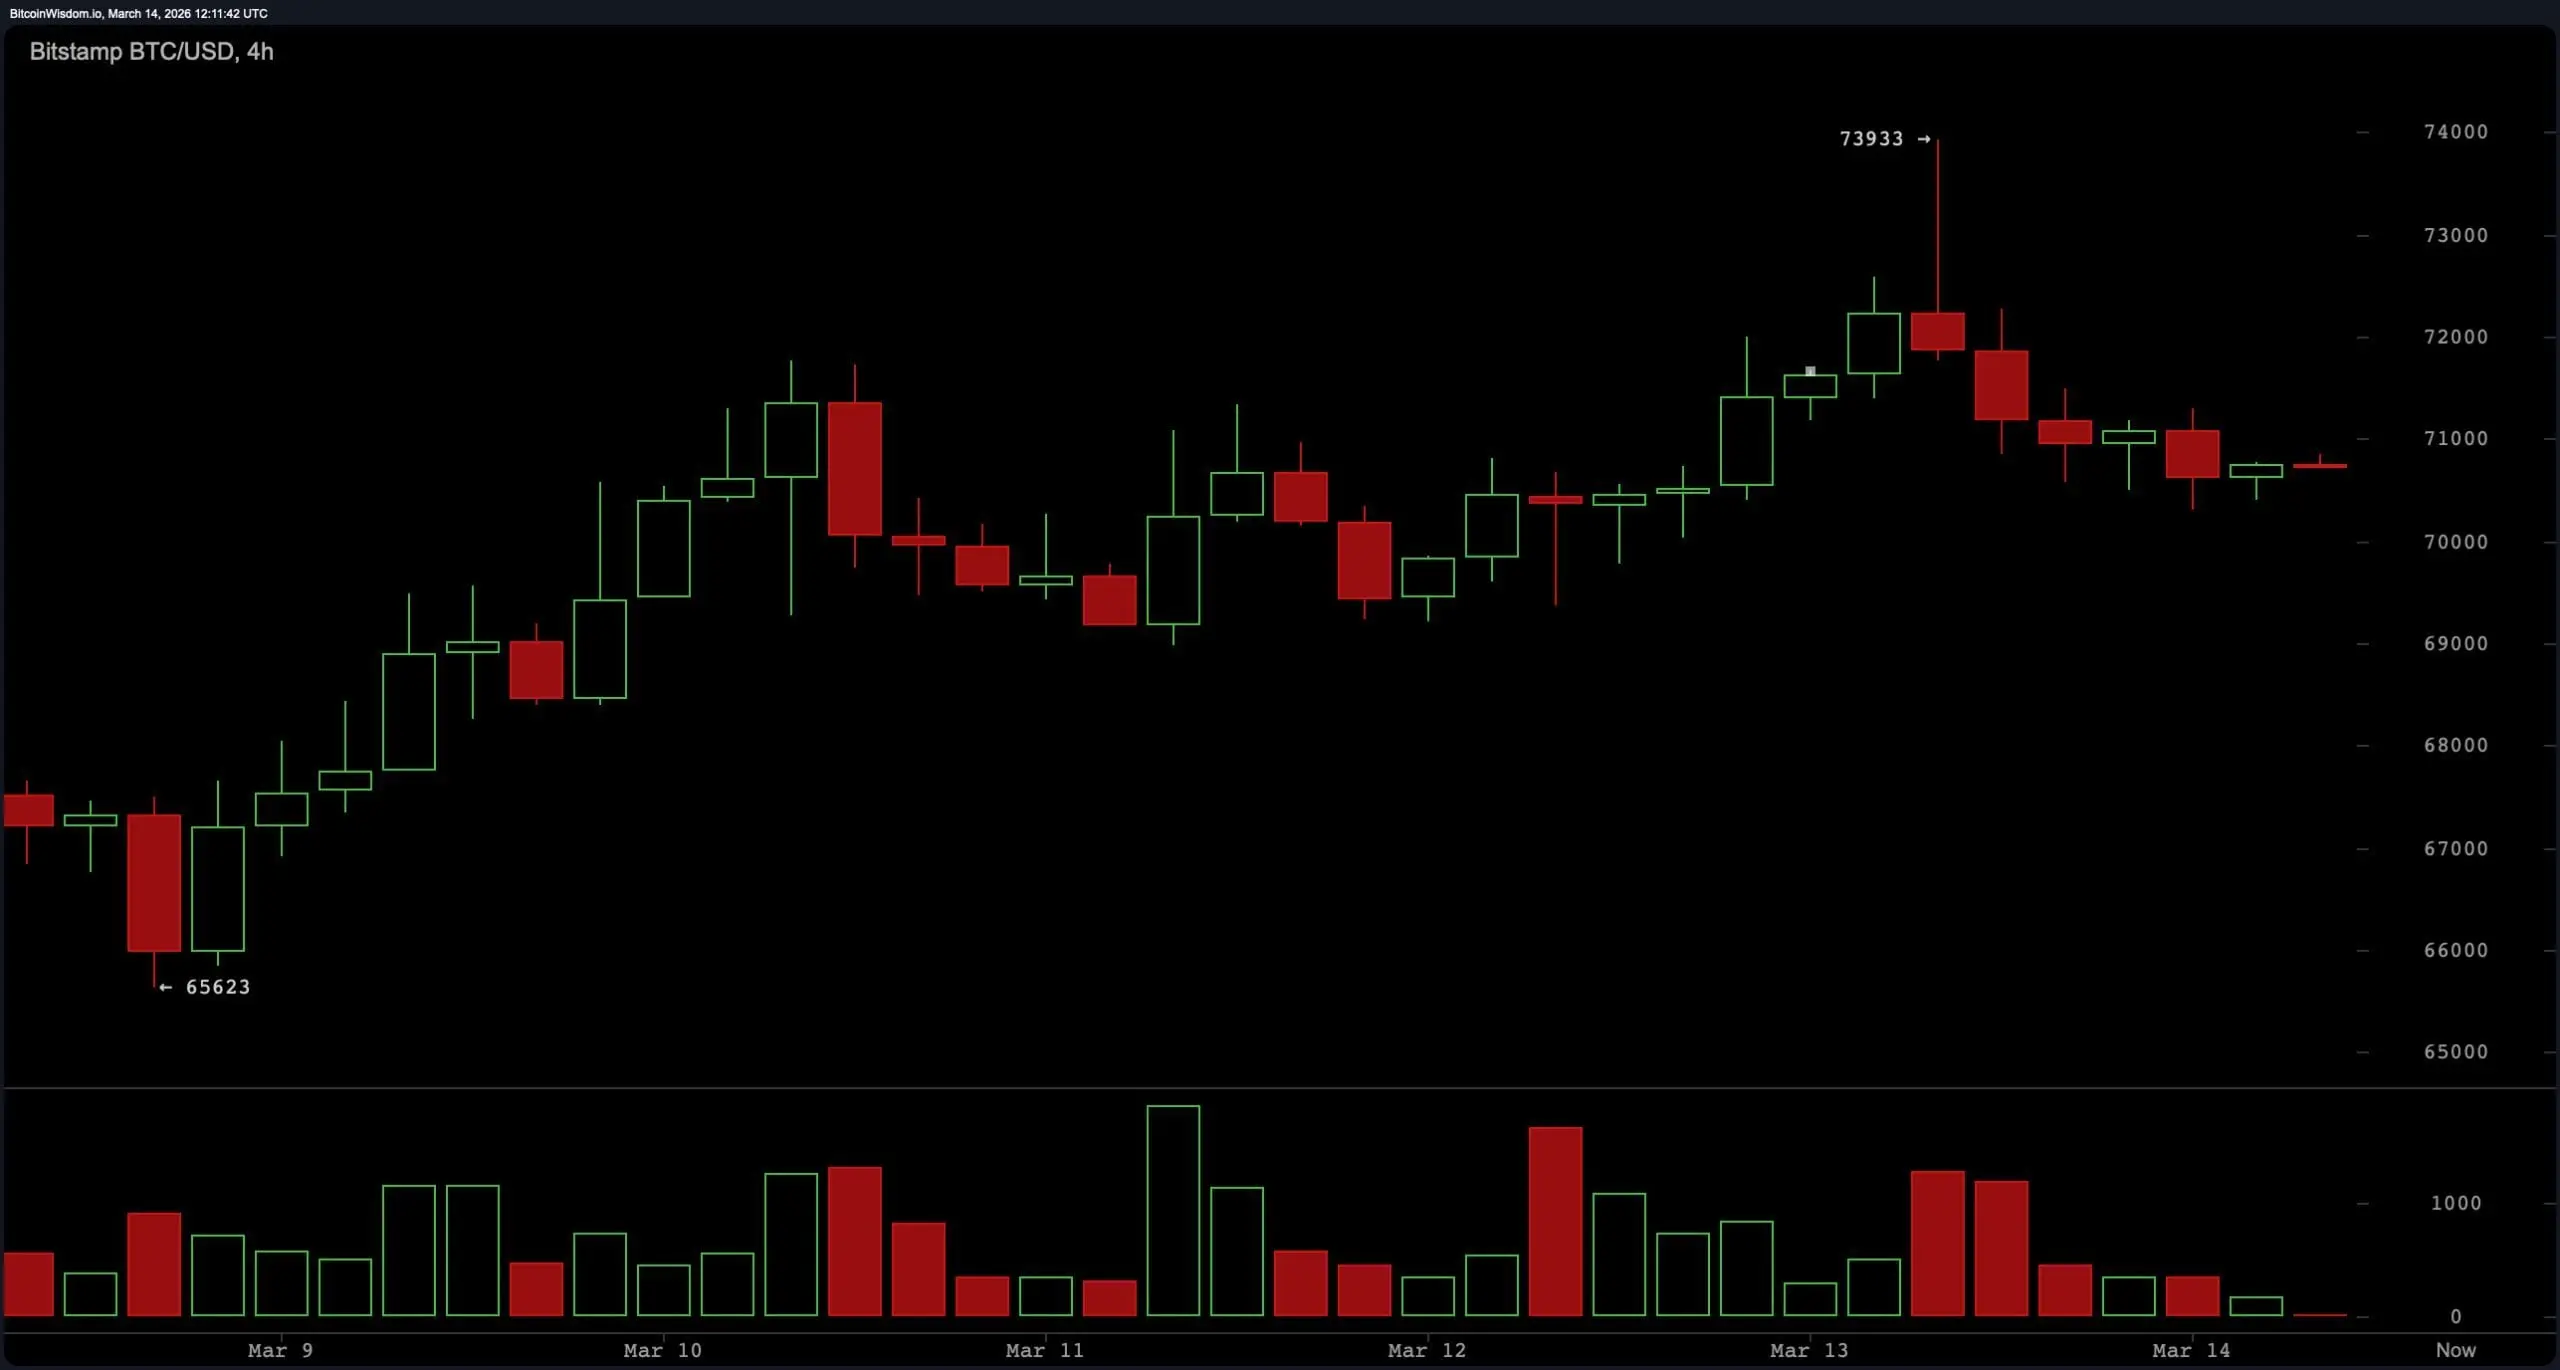 BTC/USD 4-hour chart via Bitstamp on March 14, 2026.
On the one-hour chart, bitcoin is trading within a tight intraday range between $70,300 support and approximately $71,100 resistance. Price movement has remained contained inside this narrow band while trading volume gradually declines, reflecting short-term equilibrium between buyers and sellers. Intraday consolidation within this range suggests the market is awaiting a catalyst for a breakout. Sustained movement above the $71,200 level would place the price near the upper resistance band around $72,800 and $74,000, while a breakdown below $69,500 would expose lower support areas near $67,800 and $66,000.
BTC/USD 4-hour chart via Bitstamp on March 14, 2026.
On the one-hour chart, bitcoin is trading within a tight intraday range between $70,300 support and approximately $71,100 resistance. Price movement has remained contained inside this narrow band while trading volume gradually declines, reflecting short-term equilibrium between buyers and sellers. Intraday consolidation within this range suggests the market is awaiting a catalyst for a breakout. Sustained movement above the $71,200 level would place the price near the upper resistance band around $72,800 and $74,000, while a breakdown below $69,500 would expose lower support areas near $67,800 and $66,000.
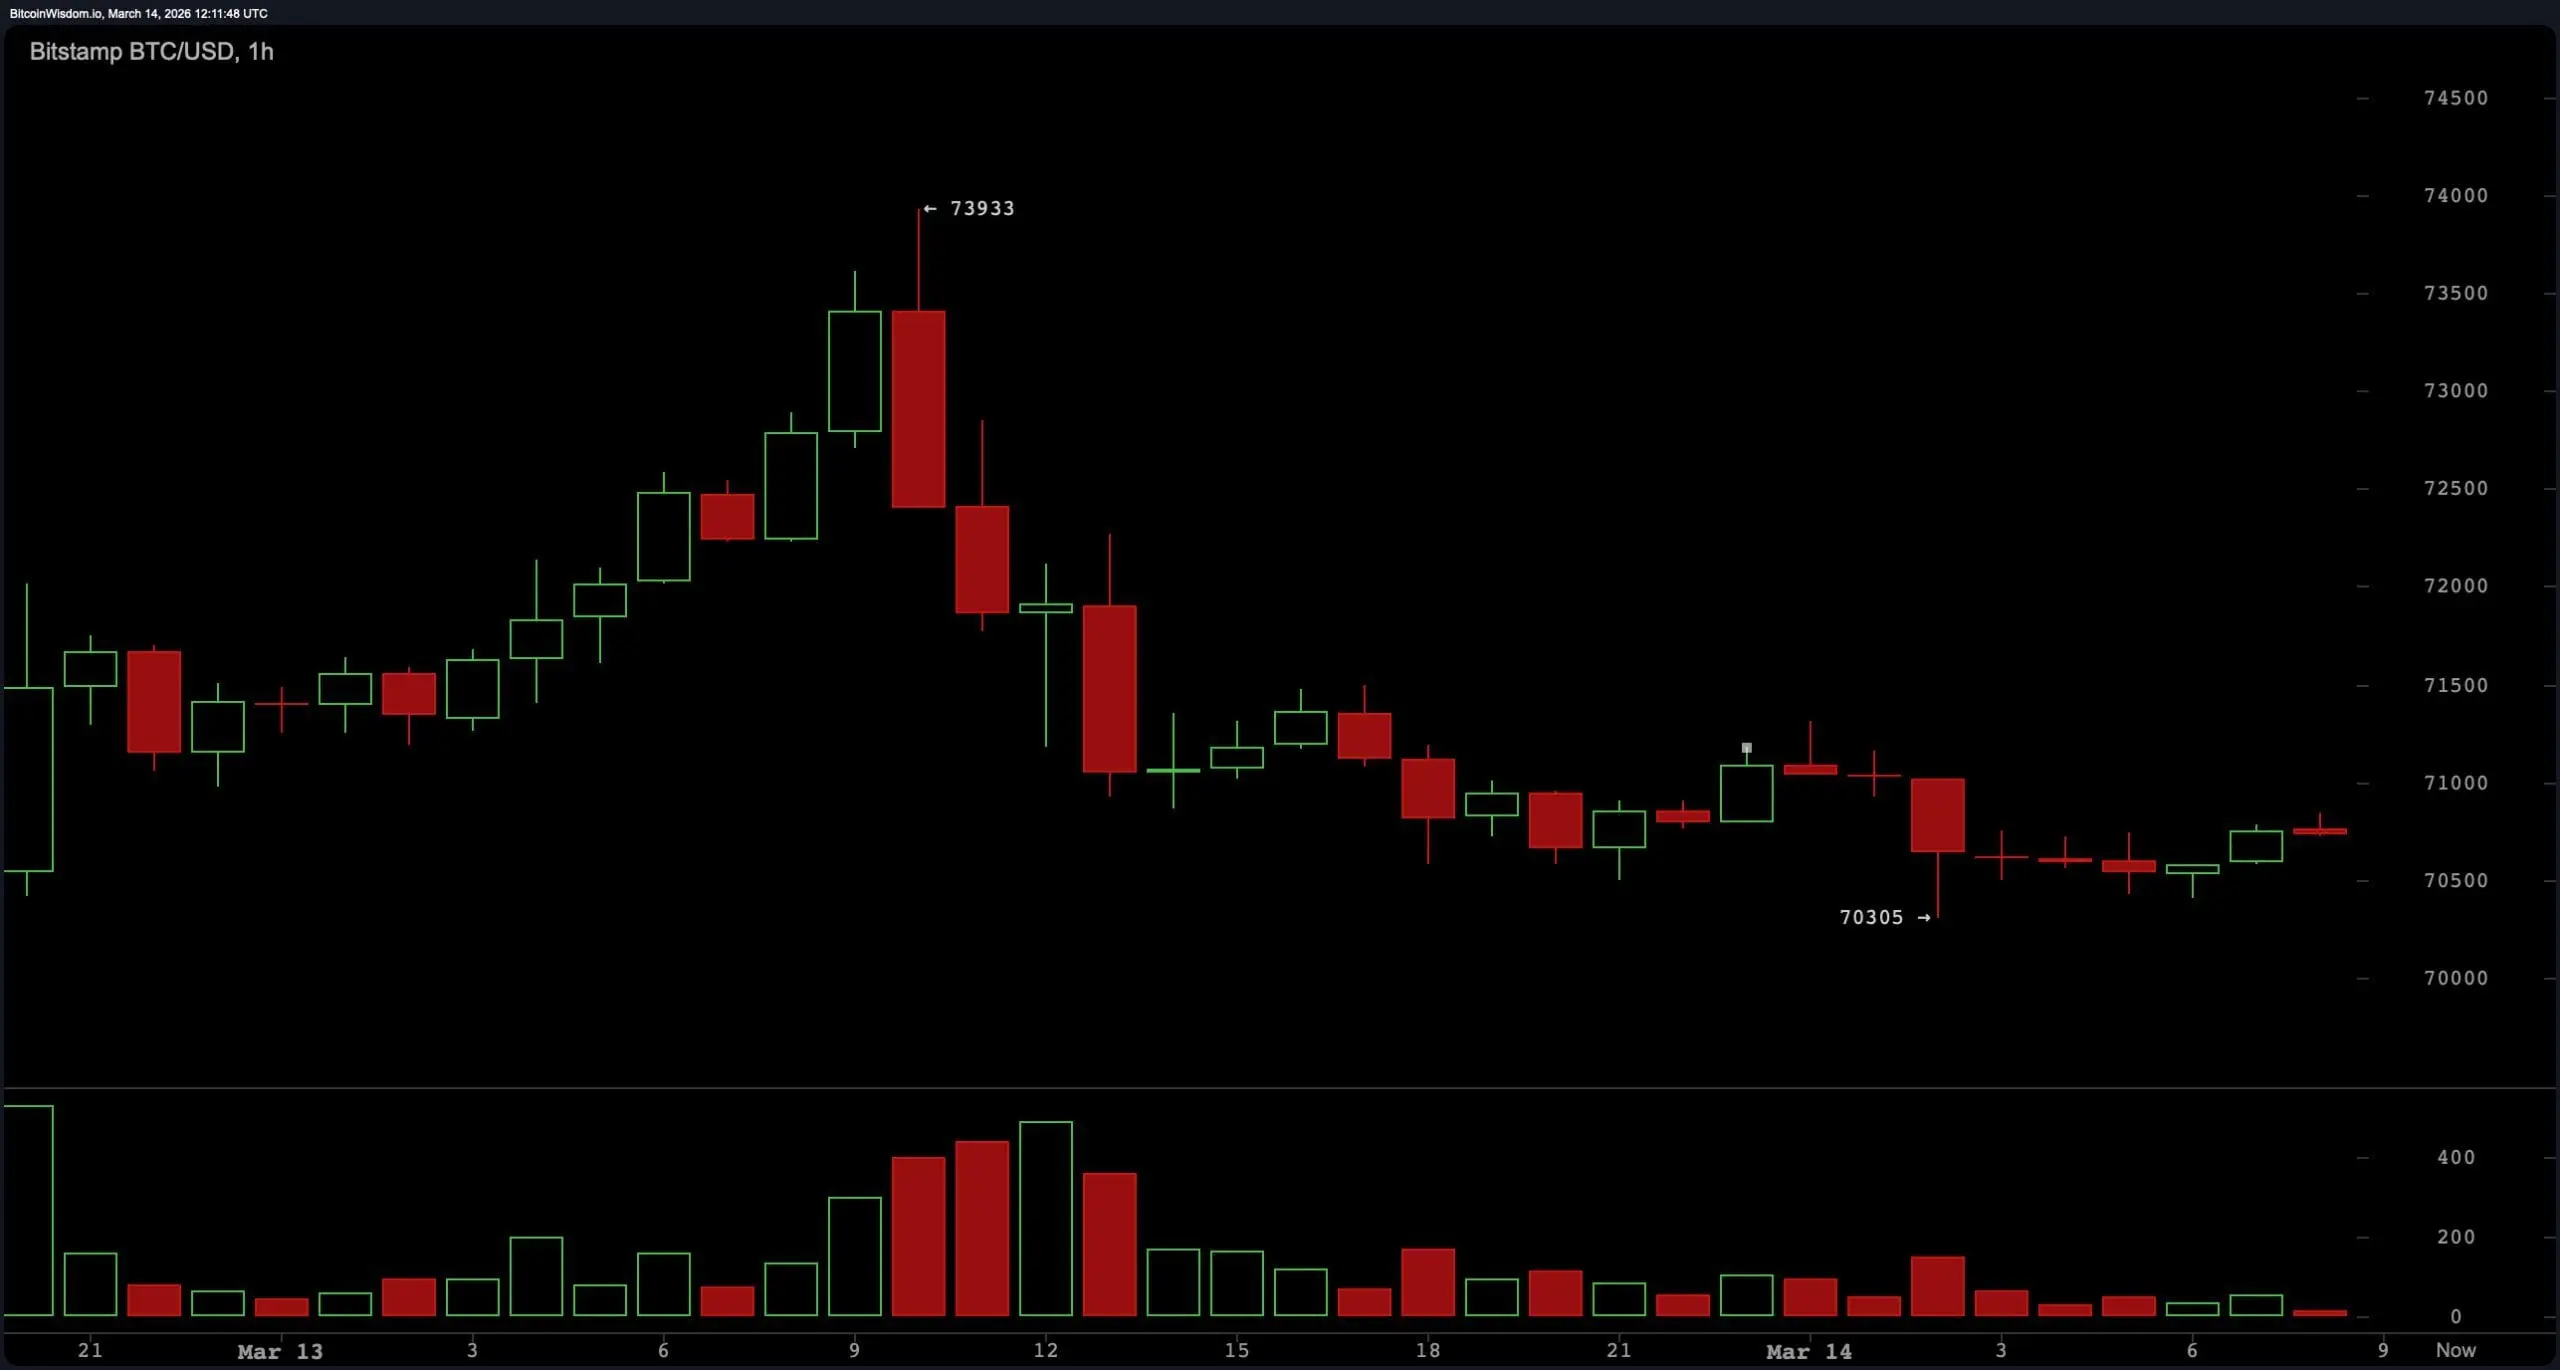 BTC/USD 1-hour chart via Bitstamp on March 14, 2026.
Oscillator readings reflect a neutral technical environment. The relative strength index ( RSI) is positioned at 53, indicating balanced momentum conditions. Stochastic reads 68, while the commodity channel index (CCI) is measured at 89, both also categorized as neutral signals.
BTC/USD 1-hour chart via Bitstamp on March 14, 2026.
Oscillator readings reflect a neutral technical environment. The relative strength index ( RSI) is positioned at 53, indicating balanced momentum conditions. Stochastic reads 68, while the commodity channel index (CCI) is measured at 89, both also categorized as neutral signals.
The average directional index (ADX) stands at 25, showing limited trend strength across the market. The Awesome oscillator records 2,432 and remains neutral. Momentum shows −1,891, signaling short-term downward pressure, while the moving average convergence divergence ( MACD) level registers −186 and signals upward momentum in the indicator summary.
Moving averages (MAs) present a split structure between short-term support and longer-term resistance levels. The exponential moving average (EMA) 10 sits at $69,648 and the simple moving average (SMA) 10 at $69,310, both signaling upward momentum relative to the current price. The EMA 20 at $69,305 and SMA 20 at $68,287 also remain supportive of the current range, along with the EMA 30 at $70,053 and SMA 30 at $68,215.
Longer-term averages reflect downward pressure, with the EMA 50 at $72,764 and the SMA 50 at $71,703 positioned above the price. Higher-period averages remain significantly elevated, including the EMA 100 at $79,665, SMA 100 at $80,935, EMA 200 at $87,978, and SMA 200 at $94,125. This distribution results in an overall neutral technical summary as short-term averages support current levels while longer-term averages remain above the market.
Bull Verdict:
If bitcoin maintains support above $69,500 and breaks decisively above the $71,200 resistance level, the current compression pattern could resolve to the upside. A sustained move through this level would clear short-term resistance and open the path toward $72,800 and a potential retest of the $73,800–$74,000 resistance zone seen on the daily chart. The sequence of higher lows on the four-hour timeframe and supportive short-term moving averages suggests underlying strength remains intact as long as price holds above the mid-range support area.
Bear Verdict:
A breakdown below the $69,500 support level would weaken the current consolidation structure and shift short-term momentum downward. Losing this level would place bitcoin below key range support and expose lower targets around $67,800, with a deeper support zone near $66,000 visible on the daily timeframe. Longer-term moving averages remaining above current price levels continue to signal overhead resistance, meaning sustained weakness below support could accelerate downside pressure if bearish momentum increases.
FAQ 🧭
- What is the bitcoin price on March 14, 2026?
Bitcoin is trading around $70,795, consolidating near the $70,000 level after rejecting resistance near $74,000.
- What are the key bitcoin resistance levels right now?
The main resistance levels for bitcoin are $71,200 in the short term and the major resistance zone between $73,800 and $74,000.
- What are the key bitcoin support levels to watch?
Key bitcoin support sits near $70,300 intraday, with stronger structural support at $69,500 and major support near $66,000.
- Is bitcoin trending up or down right now?
Bitcoin’s current technical trend is neutral as indicators and moving averages show consolidation between roughly $69,500 and $72,000.
Articles similaires
Il y a une énorme expiration d'options bitcoin de $14 milliards cette vendredi et elle pointe vers $75,000 comme aimant de prix
Le vendredi, les options bitcoin BTC$71,055.08 ou les contrats dérivés d'une valeur de milliards expireront sur l'échange crypto Deribit. Les traders pourraient noter que la dynamique de l'expiration est telle que le prix de marché du BTC pourrait être poussé vers un point très spécifique : $75,000.
Deribit, le plus grand échange crypto au monde
CoinDeskIl y a 3m
Pourquoi les marchés cryptographiques sont-ils en baisse aujourd'hui ? La guerre entre les États-Unis et l'Iran supprime la demande d'actifs spéculatifs, le Bitcoin et les altcoins sont sous pression
Au 25 mars, la capitalisation boursière du marché des cryptomonnaies s'élève à environ 2,4 billions de dollars, avec une stagnation globale. La guerre entre les États-Unis et l'Iran renforce la demande de valeurs refuge, le prix du Bitcoin se maintenant autour de 70 644 dollars. L'Irlande et Europol ont saisi 500 bitcoins. D'un point de vue technique, le Bitcoin pourrait connaître une correction à court terme, Decred faisant également face à une pression à la baisse, le marché affichant une tendance volatile.
GateNewsIl y a 3m
Le rebond du Bitcoin dépend de l'attitude de l'Iran, les nouvelles de cessez-le-feu influencent la préférence pour le risque du marché
Les reportages sur le cessez-le-feu entre l'Iran et les États-Unis provoquent une volatilité du marché, le bitcoin connaissant un rebond à court terme. Les analystes estiment que l'influence de l'Iran a dépassé les opérations militaires, le marché étant sensible aux attentes de cessez-le-feu. Un cessez-le-feu soutiendrait les actifs à risque, tandis qu'une poursuite du conflit limiterait l'espace d'appréciation du bitcoin. Les investisseurs doivent surveiller l'attitude de l'Iran.
GateNewsIl y a 33m
"Silver Iron Head Air Force" a pris partiellement ses bénéfices sur des positions longues lorsque le BTC est revenu au niveau rond de 71 000 dollars, pour un montant total de 13,5 millions de dollars.
Le 25 mars, selon les données de Hyperinsight, une baleine géante spécialisée dans les positions courtes a réduit partiellement ses positions longues en BTC après que le BTC ait brièvement chuté à 71000 dollars, fermant des positions d'une taille de 190 BTC et réalisant un profit d'environ 340000 dollars. Actuellement, cette baleine géante détient toujours une position longue en BTC de 27,6 millions de dollars, avec un profit flottant de 726000 dollars. En même temps, elle a également fermé une position longue en or de 3,1 millions de dollars.
BlockBeatNewsIl y a 34m
Les trois principaux "obstacles narratifs" pourraient limiter l'expansion du bitcoin de Strategy : risques de centralisation, menaces quantiques et préoccupations concernant la diversification
Strategy a le potentiel de devenir le plus grand détenteur de bitcoin corporatif, mais fait face à des risques de concentration, des menaces de l'informatique quantique et des problèmes de diversification du portefeuille, qui pourraient affecter sa capacité à augmenter ses avoirs. Les analystes soulignent que c'est un point d'attention clé, cependant il n'y a aucun signe que cela déclenchera un risque à grande échelle.
GateNewsIl y a 39m
