XRP Can Stage a Rally at This Level, Despite 17% Weekly Crash (Ripple Price Analysis)
CryptoPotato
Ripple’s price has experienced a notable downturn owing to the recent rapid drop in Bitcoin’s value. However, amidst this scenario, a glimmer of hope emerges for a potential short-term interruption in the prevailing downtrend.
This optimism arises as the price approaches a robust support zone marked by the 200-day moving average.
Technical Analysis
By Shayan
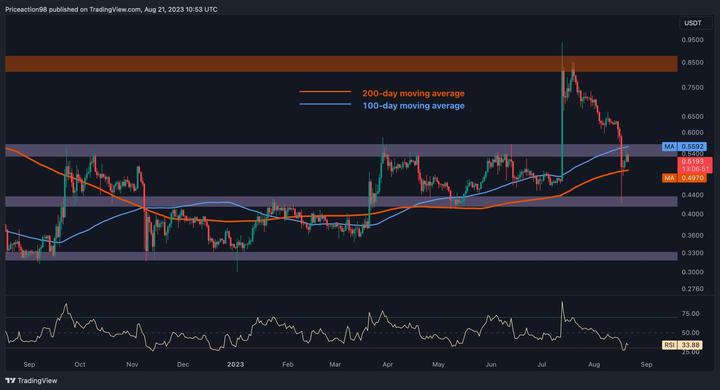
The heightened selling pressure and bearish sentiment in the market, which has led to a substantial decrease in Ripple’s price, is apparent. Consequently, this downturn has effectively halted the previous bullish momentum and resulted in an extended rejection. This decline has pushed the price below both the 100-day and 200-day moving averages, positioned at $0.55 and $0.49, respectively.
However, upon reaching the significant support level at approximately $0.42, the price encountered noteworthy support, leading to a rebound that immediately propelled it above the 200-day moving average.
This particular support zone carries the potential to arrest further downward movement and potentially facilitate a brief consolidation phase.
Notably, the price is currently confined within a narrow range delineated by the 100-day and 200-day moving averages. A breakout from this range could potentially serve as an indicator of Ripple’s imminent trajectory. This breakout might signify either a corrective phase before a continuation of the downtrend or a reversal targeting the resistance level at $0.85.
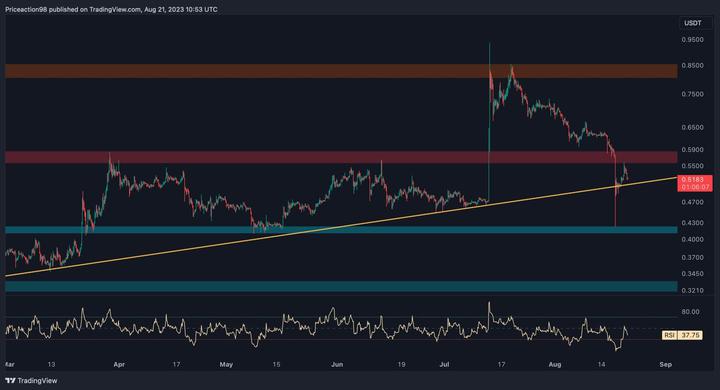
Shifting the focus to the 4-hour chart reveals that the price had been undergoing an extended uptrend, reaching a yearly peak of around $0.95. Nevertheless, a recent decline ed a retracement back to a multi-month uptrend, which has consistently provided robust support to the price movement.
While the cryptocurrency garnered support upon reaching this pivotal uptrend line and experienced a slight rebound, the prospect of another downward movement remains plausible.
Such a scenario could potentially drive the price beneath this critical dynamic support level. In such a case, a subsequent drop toward the static support at $0.42 becomes increasingly likely.
On the flip side, if buyers effectively sustain the price in the vicinity of this pivotal trendline, it could catalyze a fresh surge toward the $0.85 threshold. Such a development would inject heightened volatility into the market. Regardless of the outcome, monitoring price fluctuations is essential, as the interplay between these support and resistance levels will play a decisive role in shaping the immediate trajectory of Ripple’s price action.
免責事項:このページの情報は第三者から提供される場合があり、Gateの見解または意見を代表するものではありません。このページに表示される内容は参考情報のみであり、いかなる金融、投資、または法律上の助言を構成するものではありません。Gateは情報の正確性または完全性を保証せず、当該情報の利用に起因するいかなる損失についても責任を負いません。仮想資産への投資は高いリスクを伴い、大きな価格変動の影響を受けます。投資元本の全額を失う可能性があります。関連するリスクを十分に理解したうえで、ご自身の財務状況およびリスク許容度に基づき慎重に判断してください。詳細は免責事項をご参照ください。
コメント
0/400
コメントなし