After weeks of consolidation below a significant resistance level, Ethereum’s price has finally demonstrated a large move to the downside.
While there are still many support levels available, things are not looking good for ETH.
Technical Analysis
By: Edris
The Daily Chart:
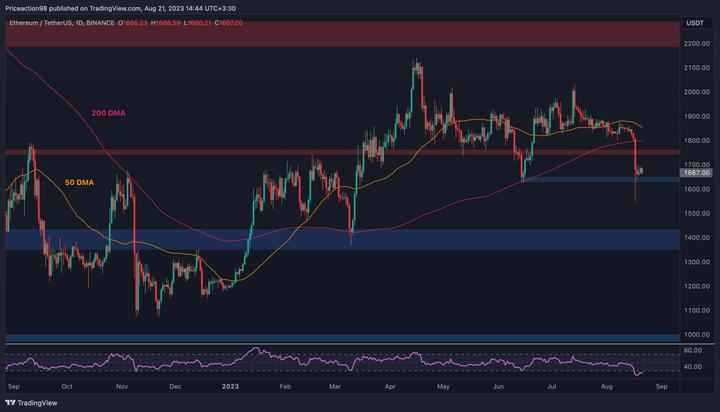
On the daily chart, the price has dropped sharply below the $1,750 level and the key 200-day moving average, located around the $1,800 mark. The mentioned moving average is one of the most important trend indicators, and the market is considered to be in a bearish phase when the price trades below it.
Currently, the short-term $1,650 support level is holding the price, as a bullish pullback seems probable. Yet, the market structure has shifted bearish with the recent decline, and a retest of the $1,400 level looks probable in the coming weeks.
 Source: TradingView### The 4-Hour Chart:
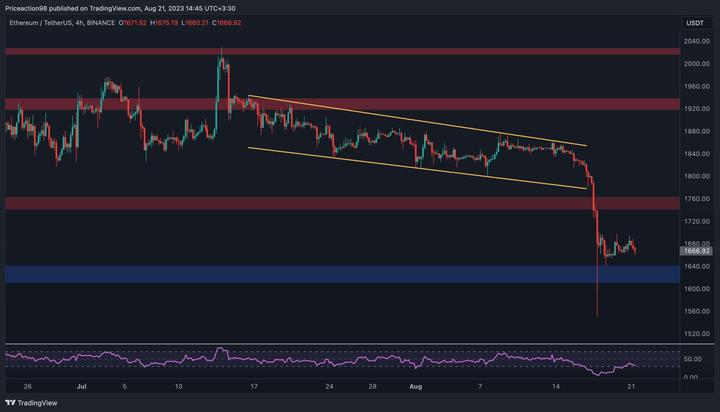
Looking at the 4-hour timeframe, it is evident that the price dropped below the large descending channel a few days ago. This breakdown has resulted in the decline being aggravated, with a large wick piercing through the $1,650 level.
However, the mentioned level has successfully supported the price until now. The RSI indicator has also recovered from the oversold region, pointing to a potential consolidation in the short term. Yet, looking at the recent price action, lower prices are still likely.
 Source: TradingView## Sentiment Analysis
By: Edris
Ethereum Open Interest
After weeks of consolidation in a tight range, Ethereum’s price experienced a sudden drop over the last few days. These sudden price moves are usually caused by futures market liquidations.
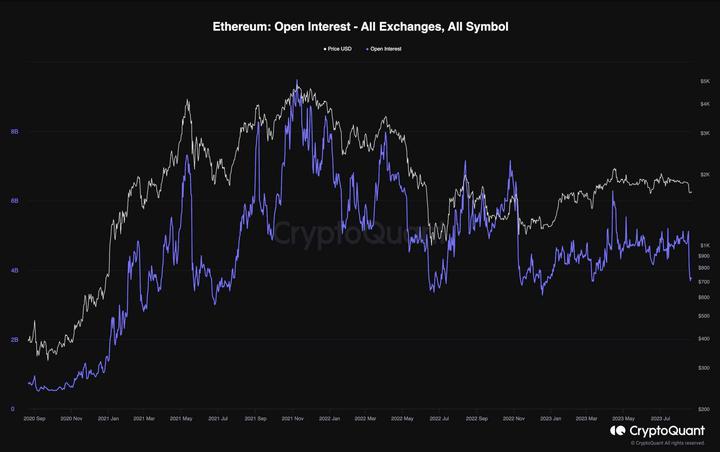
This chart demonstrates the Open Interest metric, which measures the total number of open positions in the perpetual futures markets. High values mostly lead to volatility.
As the chart depicts, the recent decline was accompanied by a sharp decrease in Open Interest. Therefore, it could be interpreted that the futures market was once again responsible for the recent drop, as the significant reduction in Open Interest indicates that the market went through a long liquidation cascade.
As a result, more stable price action can be expected in the short term, with fewer leveraged positions open at the moment.
 Source: CryptoQuant
Aviso: As informações nesta página podem ser provenientes de terceiros e não representam as opiniões ou pontos de vista da Gate. O conteúdo exibido nesta página é apenas para referência e não constitui aconselhamento financeiro, de investimento ou jurídico. A Gate não garante a exatidão ou integridade das informações e não será responsável por quaisquer perdas decorrentes do uso dessas informações. Os investimentos em ativos virtuais apresentam altos riscos e estão sujeitos a uma volatilidade de preços significativa. Você pode perder todo o capital investido. Por favor, compreenda completamente os riscos envolvidos e tome decisões prudentes com base em sua própria situação financeira e tolerância ao risco. Para mais detalhes, consulte o
Aviso Legal.

