Helium (HNT) – one of the most prominent decentralized physical infrastructure networks (dePIN) on the Solana blockchain (SOL) – has recorded an increase of over 16% in the past month, driven by the acquisition program (buyback) starting from October 20.
The daily trading volume of the token has only increased by 25%, reaching 17 million USD at the time of writing, amidst the context of prices gradually forming a potential bottoming pattern.
However, the question arises: are the on-chain signals and the fundamental factors of the project strong enough to trigger a clear reversal phase for HNT?
HNT Fee Compared to Acquisition Program
Monitoring the amount of fees generated by the Helium Network along with the acquisition events of the tokens has outlined a fairly clear trend.
Starting from October 20, Helium will begin using all collected fees to acquire HNT, thereby actively regulating the amount of tokens circulating in the market.
The first buyback rounds have helped the HNT price surge significantly, but this effect seems to have slowed down since the beginning of November.
In the past month, an average of about 30,000 USD worth of HNT has been acquired each day.
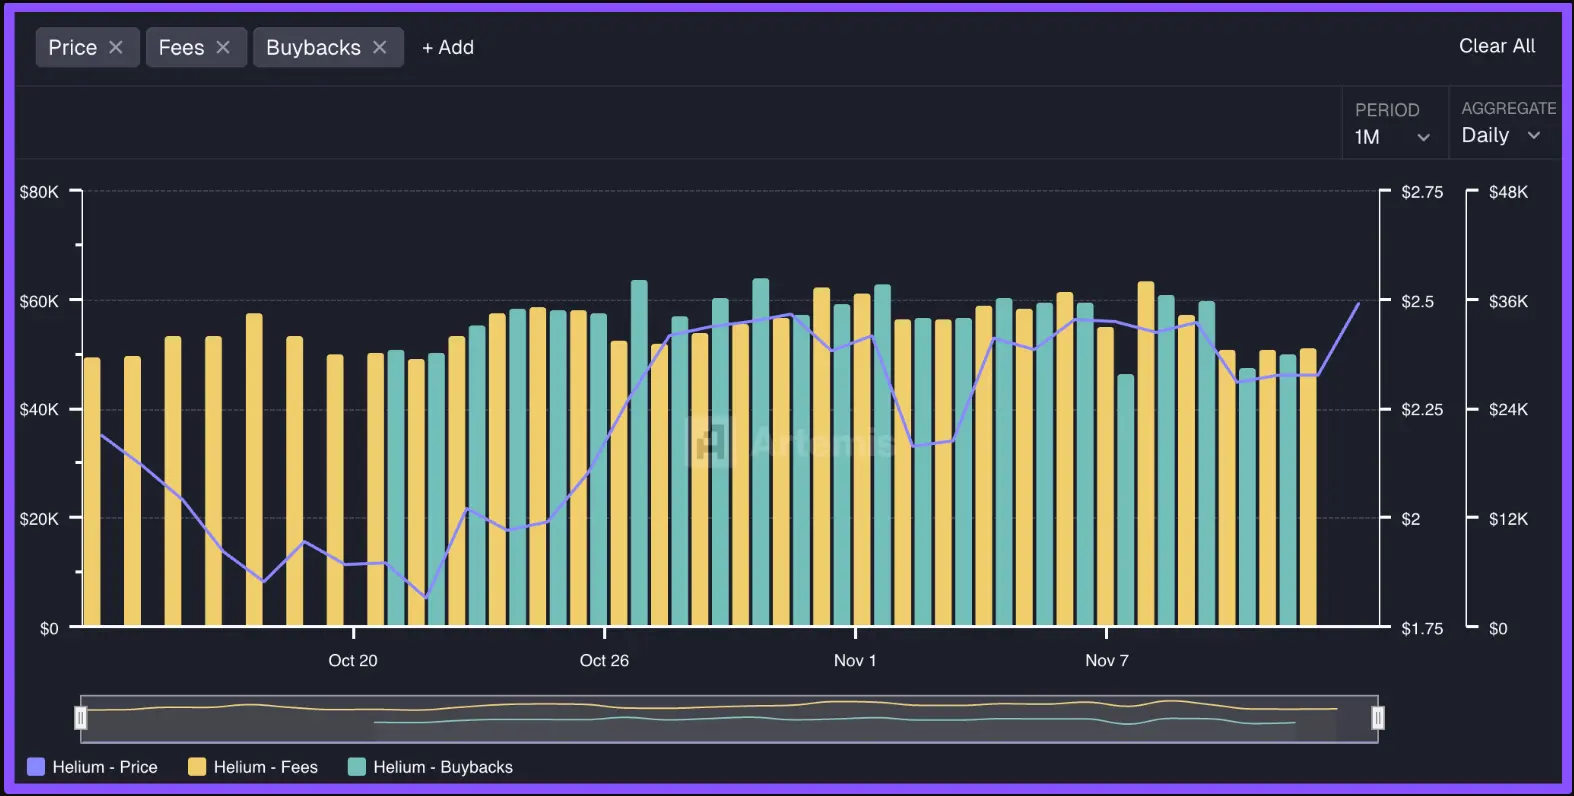 Source: ArtemisNevertheless, the buyback program still plays a crucial role in helping to reduce the circulating supply — a factor that may continue to support the price, as long as market demand is maintained accordingly.
Explosion in token transfer volume and DEX trading
Similarly, the volume of token transfers and transactions on DEX exchanges has also recorded a breakthrough. According to data from Solscan, the total transfer value on the previous day reached 30 million USD.
The trading volume of HNT on DEX reached 3 million USD — the highest level of the week, with a total number of transfers exceeding 40,000, demonstrating an almost parabolic increase since November 11.
In terms of transaction structure, the total sales value is 1.32 million USD, while the purchase orders reached 1.47 million USD, indicating that demand outstripped supply in the past week.
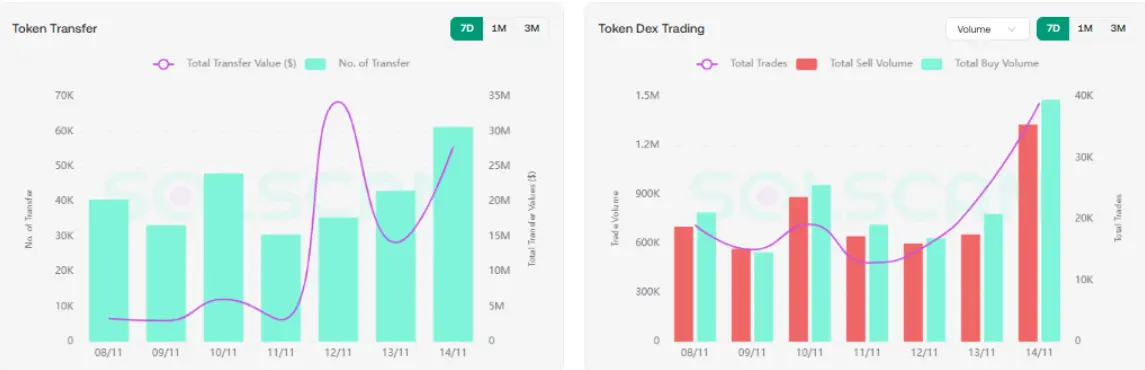 Source: SolscanAlthough the on-chain metrics and the fundamentals are leaning towards an upward trend, the current price action also reflects a clear consensus in the market.
Price Action Analysis of HNT
HNT has just undergone a short-term correction but remains strong at the support level of 2 USD. Instead of breaking through this area, the price maintains within the structure of the head and shoulders pattern, while also developing a potential price base.
The Bull Bear Power indicator (BBP) shows that the struggle between the bulls and the bears remains intense, with a slight advantage leaning towards the bulls at the current moment.
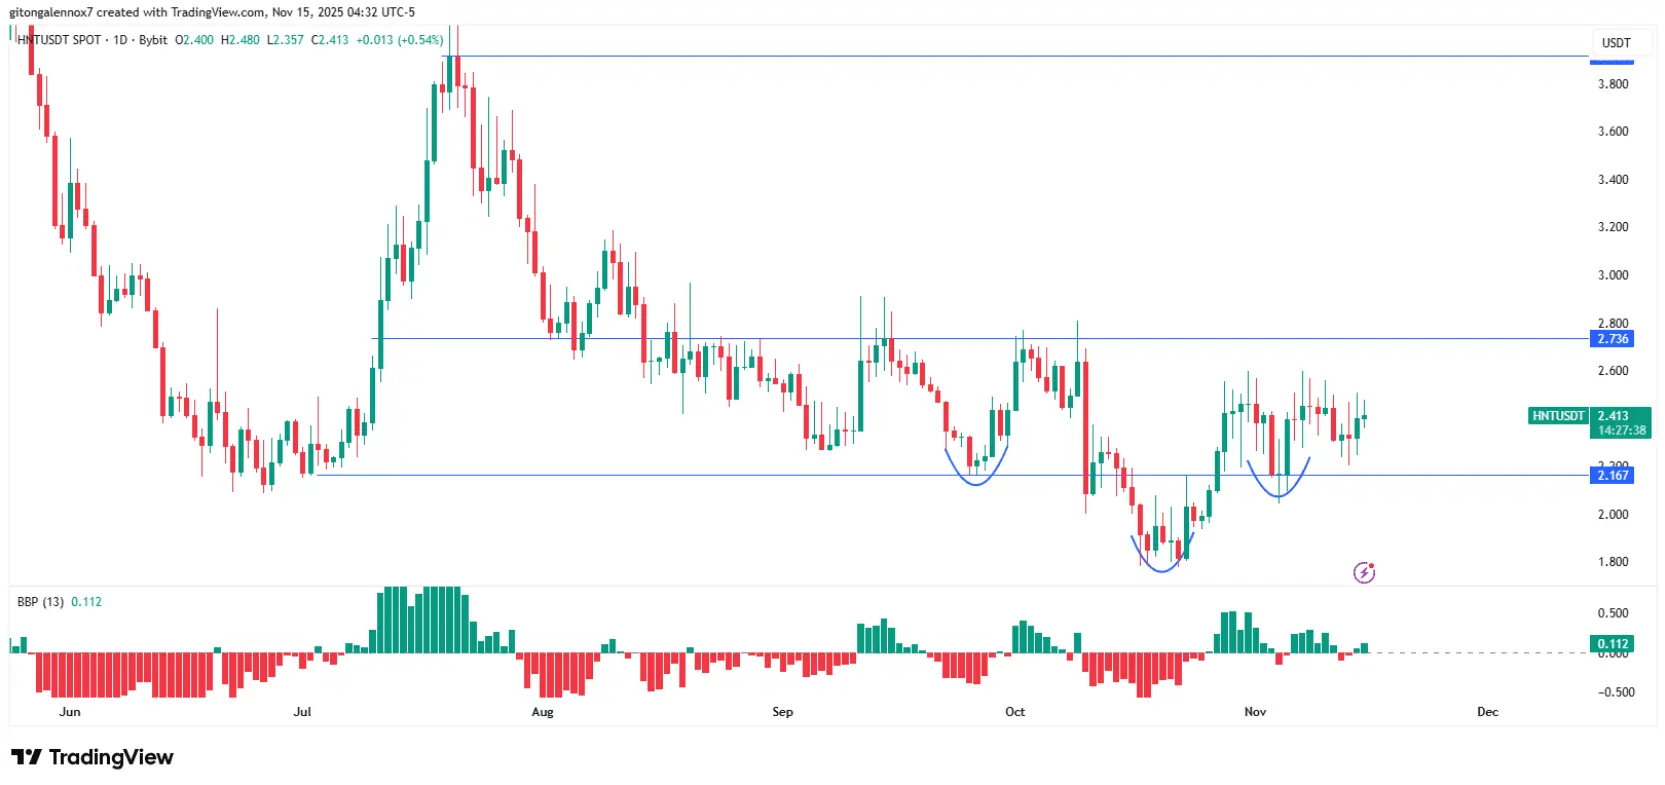 Source: TradingViewTo confirm a bullish breakout, HNT needs to close a candle above the resistance zone of 2.74 USD. If successful, the price could move towards the 4 USD zone. Conversely, HNT is likely to continue accumulating within the range of 2.17–2.74 USD.
However, the overall picture of the cryptocurrency market still has many unstable factors. A breakdown below the pattern would completely negate the potential bottom formation.
In summary, HNT is still supported by the acquisition program along with an increase in trading volume on DEX exchanges. However, the overall weakening factor of the market still creates significant risks for bullish expectations.
SN_Nour
Disclaimer: The information on this page may come from third parties and does not represent the views or opinions of Gate. The content displayed on this page is for reference only and does not constitute any financial, investment, or legal advice. Gate does not guarantee the accuracy or completeness of the information and shall not be liable for any losses arising from the use of this information. Virtual asset investments carry high risks and are subject to significant price volatility. You may lose all of your invested principal. Please fully understand the relevant risks and make prudent decisions based on your own financial situation and risk tolerance. For details, please refer to
Disclaimer.
Related Articles
CryptoQuant: Ethereum Faces "Adoption Paradox," ETH Could Drop to $1,500
Ethereum is facing an "adoption paradox," with network activity reaching all-time highs while ETH price has declined significantly. CryptoQuant analysis indicates that if the bear market persists, ETH could fall to $1,500. The relationship between exchange inflows and price dynamics is more pronounced, suggesting ETH is facing strong selling pressure.
GateNews33m ago
Today's cryptocurrency Fear and Greed Index dropped to 15, with the market still in extreme panic mode
Gate News: On March 13, according to Alternative.me data, the Cryptocurrency Fear and Greed Index fell to 15 today, down further from yesterday's 18, with the market still in an "extreme fear state."
GateNews37m ago
ETH 15-minute increase of 0.79%: Liquidity phase decline and short-term fund arbitrage resonance driving upward momentum
March 13, 2026, 00:00 to 00:15 (UTC), Ethereum (ETH) experienced a significant upward price movement in a short timeframe, with the 15-minute interval return reaching +0.79%. The price range was 2070.45 to 2090.33 USDT, with a volatility amplitude of 0.96%. Market fluctuations intensified during this period, capturing traders' attention.
The primary driver of this price movement was a phase-wise decline in market liquidity. During this period, there were no on-chain large transfers, DeFi liquidations, or significant derivatives liquidations recorded. Major macro and industry news updates also showed no sudden events. During the Europe-US trading session
GateNews37m ago
BTC 15-minute surge of 0.84%: On-chain fund flow and technical breakout synergy drive volatility
March 13, 2026, 00:00 to 00:15 (UTC), BTC price fluctuated within the range of 70394.0 to 71116.3 USDT in just 15 minutes, with a return rate of +0.84% and volatility amplitude reaching 1.02%. During this period, mainstream market attention increased, driving active trading and notably elevated price volatility, reflecting a marked warming of market sentiment during this timeframe.
The primary driver of this price movement was large on-chain fund transfers and concentrated whale account buying activity. Historical on-chain data observations show that single transfers exceeding 1000 BTC have frequently served as catalysts for upward price movements.
GateNews37m ago
Oil prices soar past $100, U.S. stocks hit new lows for the year, Bitcoin holds steady at 70k
Due to the ongoing Iran conflict, oil prices have surged significantly, with Brent crude breaking $100 per barrel for the first time. U.S. stock indices' three major indexes hit new lows since 2026. The crypto market remained relatively stable, with Bitcoin holding around $70,000. Goldman Sachs warned that if oil supply remains weak, prices could spike to 2008 highs.
ChainNewsAbmedia1h ago
Chainlink (LINK) Price Prediction: What Comes Next After the Wave 5 Decline
Chainlink seems to have found a familiar groove. It has been moving sideways after the fall from the February highs of $12.50. Both bulls and bears are waiting for a clear trend in the cryptocurrency. The daily chop hides a more structured picture beneath the surface, one that technical
CaptainAltcoin1h ago