U.S. spot XRP ETFs continued their impressive streak last week, attracting $82 million in net inflows while Bitcoin and Ethereum ETFs suffered significant redemptions amid broader market pressure.
Key Highlights
- Spot XRP ETFs recorded $82 million in weekly inflows, pushing total assets under management (AUM) past $1.2 billion.
- This marks six consecutive weeks of positive flows since launch in mid-November.
- In contrast, Bitcoin ETFs saw $497 million in outflows, while Ethereum ETFs bled $644 million.
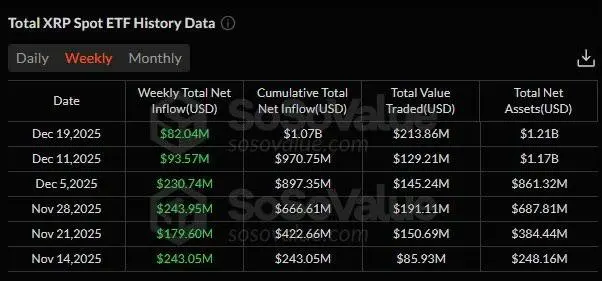
(Sources: SoSoValue)
XRP ETFs Defy Market Headwinds
Since going live in mid-November 2025, U.S. spot XRP ETFs have demonstrated remarkable resilience, maintaining consistent inflows despite macroeconomic uncertainties and weakness in major cryptocurrencies.
The products have now surpassed $1.2 billion in AUM, underscoring sustained investor interest. Industry experts highlighted this performance during a recent podcast featuring Ripple CTO David Schwartz, Canary Capital CEO Steven McClurg, and Bitwise CIO Matt Hougan.
Initial inflows were largely retail-driven, but institutional capital—particularly from pension funds and insurance companies outside the U.S.—quickly followed. McClurg noted that XRP’s clear utility in cross-border payments and liquidity provision makes it more accessible and relatable for traditional finance players compared to other digital assets.
Bitwise’s Matt Hougan added that financial advisors increasingly favor cryptocurrencies with proven longevity and straightforward use cases. XRP’s long operational history and role in facilitating cross-currency settlements and stablecoin flows align well with these preferences.
Despite the robust ETF performance, XRP’s spot price has struggled, briefly dipping below $2.00 last week amid broader altcoin weakness and bearish market sentiment.
Bitcoin and Ethereum ETFs Face Heavy Redemptions
Last week’s outflows from Bitcoin and Ethereum ETFs were exacerbated by macroeconomic factors, including the Bank of Japan’s rate decisions and renewed selling pressure on major cryptos.
According to SoSoValue data:
- Bitcoin ETFs: $497 million in net outflows
- Ethereum ETFs: $644 million in net outflows
Rotation Toward Altcoin ETFs
While capital exited BTC and ETH products, other altcoin-focused ETFs attracted fresh money:
- Solana ETFs recorded $66.5 million in weekly inflows.
This divergence highlights a clear rotational trend, with institutional investors shifting exposure from the top two cryptocurrencies toward select altcoins perceived to offer stronger utility or growth potential.
XRP ETFs Performance FAQ
How much did XRP ETFs attract last week?
U.S. spot XRP ETFs saw $82 million in net inflows for the week, maintaining positive momentum.
What is the current total AUM for XRP ETFs?
Assets under management have crossed $1.2 billion since the products launched in mid-November 2025.
How many consecutive weeks of inflows have XRP ETFs recorded?
Six straight weeks of net positive flows, demonstrating resilience amid challenging market conditions.
Why are institutions showing interest in XRP ETFs?
XRP’s established role in cross-border payments and liquidity provision is easier for traditional investors (pension funds, insurance companies, financial advisors) to understand compared to other cryptos.
How did BTC and ETH ETFs perform in comparison?
Bitcoin ETFs lost $497 million, while Ethereum ETFs saw $644 million in outflows last week.
Are other altcoin ETFs also seeing inflows?
Yes—Solana ETFs attracted $66.5 million in net inflows, signaling capital rotation away from BTC/ETH toward select altcoins.
Has the XRP price benefited from these ETF inflows?
Not yet significantly—XRP recently traded below $2.00, reflecting broader market weakness despite strong ETF demand.
Disclaimer: The information on this page may come from third parties and does not represent the views or opinions of Gate. The content displayed on this page is for reference only and does not constitute any financial, investment, or legal advice. Gate does not guarantee the accuracy or completeness of the information and shall not be liable for any losses arising from the use of this information. Virtual asset investments carry high risks and are subject to significant price volatility. You may lose all of your invested principal. Please fully understand the relevant risks and make prudent decisions based on your own financial situation and risk tolerance. For details, please refer to
Disclaimer.
Related Articles
Strategy Buys 17,994 BTC for $1.28B, Bitcoin Holdings Reach 738,731
Strategy purchased 17,994 BTC and raised its Bitcoin holdings to 738,731 BTC, according to the SEC filing.
Strategy now holds about 3.7% of Bitcoin supply after buying nearly five weeks of newly mined BTC.
Strategy funded the latest Bitcoin purchase through sales of MSTR and STRC
CryptoNewsLand21m ago
A certain whale sold 75 BTC in the past 20 hours and bought 2.067 billion PUMP from Wintermute.
Gate News Report, March 10 — According to Onchain Lens monitoring, a certain whale (address 24BLF...LChr) sold 75 BTC worth $5.08 million in the past 20 hours and bought 2.067 billion PUMP tokens from market maker Wintermute, valued at $4.04 million.
GateNews1h ago
Bitcoin-Tech Stock Correlation Is Overblown, NYDIG
Bitcoin’s recent price action has traced the footsteps of US software equities, driven more by macro liquidity conditions than a lasting structural link to the tech sector. In a note issued on Friday, Greg Cipolaro, NYDIG’s head of research, argued that the visual fit between BTC and software
CryptoBreaking1h ago
Michael Saylor’s Strategy Builds $50 Billion Bitcoin Treasury With 738,731 BTC
Michael Saylor’s company, Strategy, has become the largest corporate Bitcoin holder with over 738,000 BTC, valued at approximately $50.7 billion. Their strategy involves aggressive accumulation using corporate funds and debt financing, significantly influencing corporate finance and Bitcoin adoption.
CryptometerIo1h ago
A certain whale received 245 BTC again eight hours ago, accumulating a total of 495.3 BTC purchased over the past two weeks.
Gate News reports that on March 10th, according to The Data Nerd monitoring, eight hours ago, a whale address bc1q8 received another 245 BTC (approximately $16.8 million). Data shows that over the past two weeks, this whale has accumulated a total of 495.3 BTC (approximately $33.4 million) through an institution, with an average purchase price of about $67,430.
GateNews2h ago
Bitcoin returns to $70,000: Geopolitical conflict concerns ease, ETF fund inflows continue to drive BTC rebound
On March 10th, Bitcoin broke through $70,000 during the East Asian trading session, completing a recovery after the weekend sell-off. As volatility in the energy markets eased, selling pressure on risk assets diminished. Market data shows that institutional capital inflows continue to support Bitcoin, investor sentiment is improving, and short-term upside potential is increasing.
GateNews2h ago