Date: Sun, Dec 21 2025 | 10:26 AM GMT
The broader cryptocurrency market has continued to struggle with uneven and choppy price action over the past several weeks, a phase that began after the sharp sell-off on October 10. That correction pushed Ethereum (ETH) lower by nearly 26% over the last 60 days, keeping sustained pressure across the altcoin market. **Stellar (XLM) **has been no exception, remaining under selling pressure as risk appetite across the sector stays muted.
**XLM **is down more than 29% over the past two months, but beneath the surface, the weekly chart is starting to reveal a technical structure that could lay the groundwork for a potential rebound if key levels continue to hold.
Source: Coinmarketcap
Descending Triangle Structure Comes Into Focus
On the weekly timeframe, XLM has been trading within a large descending triangle formation. This pattern is defined by a series of lower highs pressing against a relatively flat support base, reflecting consistent selling pressure from the top while buyers defend the same demand zone below. While descending triangles are often viewed as bearish continuation structures, repeated defenses of the base can also precede sharp upside reactions, particularly when broader market sentiment is already pessimistic.
The chart shows XLM once again pulling back into the critical $0.20–$0.22 support region. This zone has acted as a reliable demand area throughout the year, with each visit producing long lower wicks and swift reactions from buyers. These candle structures suggest that accumulation is taking place, even as price continues to respect the descending trendline from above. Despite months of pressure, sellers have so far been unable to force a decisive breakdown below this floor.
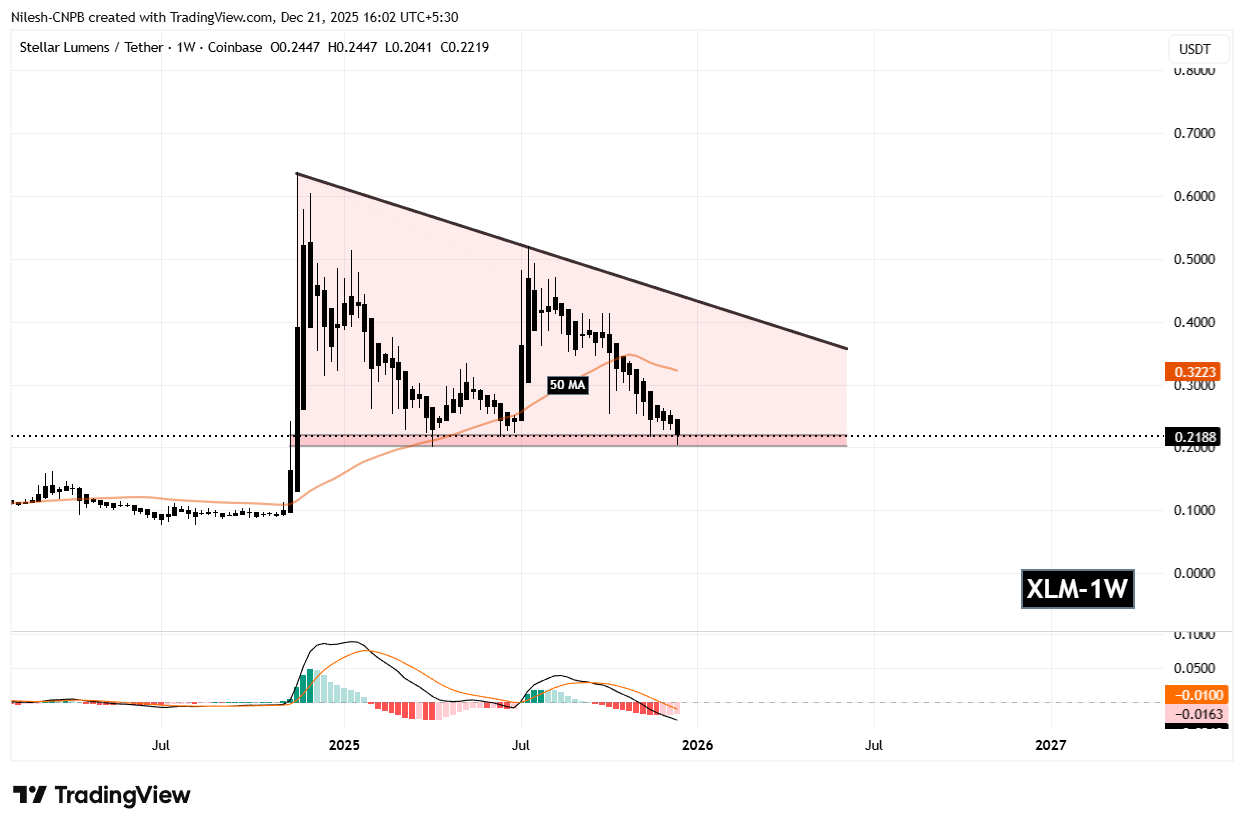
Stellar (XLM) Daily Chart/Coinsprobe (Source: Tradingview)
At the same time, XLM is trading below its 50-week moving average, currently near the $0.32 region. This moving average has historically marked important shifts in trend direction, and price behavior around it often determines whether rallies can gain traction or fade quickly.
What’s Next for XLM?
As long as the $0.20–$0.22 support zone remains intact, the probability of a rebound stays firmly on the table. A sustained defense of this level could allow XLM to stabilize and attempt a move back toward the descending trendline resistance near $0.32. This area aligns closely with the 50-week moving average, making it a key zone that bulls would need to reclaim to signal improving market structure.
A decisive weekly close above the descending trendline would be a notable technical development. Such a move would invalidate the bearish bias of the triangle and could open the door for a broader trend reversal, especially if accompanied by rising volume and improving momentum across the wider crypto market.
That said, the downside risk remains clearly defined. A weekly close below the $0.20 support would confirm a breakdown from the triangle and could expose XLM to deeper declines, with the next major support area sitting closer to the $0.13 region.
For now, Stellar sits at a pivotal inflection point. With price pressing against long-term support and sellers struggling to force a breakdown, the coming weeks are likely to be decisive in determining whether XLM can stage a meaningful rebound or extend its broader corrective trend.
Disclaimer: The views and analysis presented in this article are for informational purposes only and reflect the author’s perspective, not financial advice. Technical patterns and indicators discussed are subject to market volatility and may or may not yield the anticipated results. Investors are advised to exercise caution, conduct independent research, and make decisions aligned with their individual risk tolerance.
Disclaimer: The information on this page may come from third parties and does not represent the views or opinions of Gate. The content displayed on this page is for reference only and does not constitute any financial, investment, or legal advice. Gate does not guarantee the accuracy or completeness of the information and shall not be liable for any losses arising from the use of this information. Virtual asset investments carry high risks and are subject to significant price volatility. You may lose all of your invested principal. Please fully understand the relevant risks and make prudent decisions based on your own financial situation and risk tolerance. For details, please refer to
Disclaimer.
Related Articles
CryptoQuant: Ethereum Faces "Adoption Paradox," ETH Could Drop to $1,500
Ethereum is facing an "adoption paradox," with network activity reaching all-time highs while ETH price has declined significantly. CryptoQuant analysis indicates that if the bear market persists, ETH could fall to $1,500. The relationship between exchange inflows and price dynamics is more pronounced, suggesting ETH is facing strong selling pressure.
GateNews15m ago
Today's cryptocurrency Fear and Greed Index dropped to 15, with the market still in extreme panic mode
Gate News: On March 13, according to Alternative.me data, the Cryptocurrency Fear and Greed Index fell to 15 today, down further from yesterday's 18, with the market still in an "extreme fear state."
GateNews19m ago
ETH 15-minute increase of 0.79%: Liquidity phase decline and short-term fund arbitrage resonance driving upward momentum
March 13, 2026, 00:00 to 00:15 (UTC), Ethereum (ETH) experienced a significant upward price movement in a short timeframe, with the 15-minute interval return reaching +0.79%. The price range was 2070.45 to 2090.33 USDT, with a volatility amplitude of 0.96%. Market fluctuations intensified during this period, capturing traders' attention.
The primary driver of this price movement was a phase-wise decline in market liquidity. During this period, there were no on-chain large transfers, DeFi liquidations, or significant derivatives liquidations recorded. Major macro and industry news updates also showed no sudden events. During the Europe-US trading session
GateNews19m ago
BTC 15-minute surge of 0.84%: On-chain fund flow and technical breakout synergy drive volatility
March 13, 2026, 00:00 to 00:15 (UTC), BTC price fluctuated within the range of 70394.0 to 71116.3 USDT in just 15 minutes, with a return rate of +0.84% and volatility amplitude reaching 1.02%. During this period, mainstream market attention increased, driving active trading and notably elevated price volatility, reflecting a marked warming of market sentiment during this timeframe.
The primary driver of this price movement was large on-chain fund transfers and concentrated whale account buying activity. Historical on-chain data observations show that single transfers exceeding 1000 BTC have frequently served as catalysts for upward price movements.
GateNews19m ago
Oil prices soar past $100, U.S. stocks hit new lows for the year, Bitcoin holds steady at 70k
Due to the ongoing Iran conflict, oil prices have surged significantly, with Brent crude breaking $100 per barrel for the first time. U.S. stock indices' three major indexes hit new lows since 2026. The crypto market remained relatively stable, with Bitcoin holding around $70,000. Goldman Sachs warned that if oil supply remains weak, prices could spike to 2008 highs.
ChainNewsAbmedia51m ago
Chainlink (LINK) Price Prediction: What Comes Next After the Wave 5 Decline
Chainlink seems to have found a familiar groove. It has been moving sideways after the fall from the February highs of $12.50. Both bulls and bears are waiting for a clear trend in the cryptocurrency. The daily chop hides a more structured picture beneath the surface, one that technical
CaptainAltcoin1h ago