
Date: Tue, Dec 23, 2025 | 06:01 PM GMT
The broader cryptocurrency market has remained under pressure over the past several weeks, with the ongoing corrective phase weighing heavily on overall altcoin sentiment. Monad (MON) has also felt the impact of this weakness, as persistent selling pressure has kept price action subdued and volatile.
MON has declined by nearly 32% over the past 30 days, yet a closer look at the chart suggests that the current structure may be more constructive than it appears at first glance. Interestingly, Monad’s recent price behavior is beginning to resemble a bottoming pattern that previously played out on Hyperliquid (HYPE), a setup that eventually led to a powerful upside reversal earlier this year.
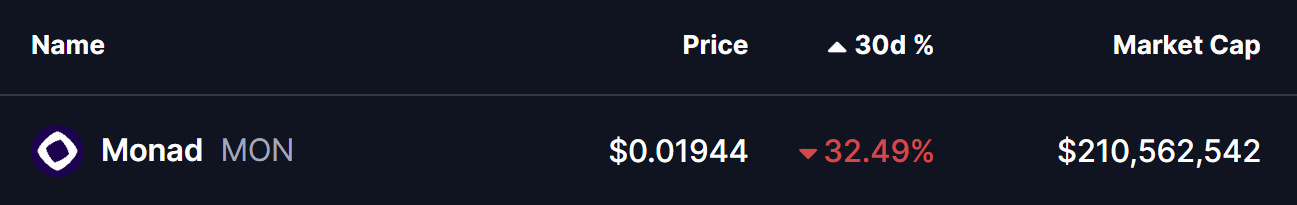
Source: Coinmarketcap
MON Mirrors HYPE’s Fractal Structure
On the comparative charts, MON appears to be tracing a structure strikingly similar to HYPE’s April 2025 fractal. In HYPE’s case, the token endured a deep 73% correction from its all-time high before forming a broadening wedge structure near the bottom. That consolidation phase ultimately resolved to the upside, with price reclaiming its key moving average and triggering a rally of more than 160% in the weeks that followed.
Monad’s decline from its own all-time high has reached roughly 65%, placing it well within the range of historical washout zones often associated with trend exhaustion. The current setup shows MON compressing within a symmetrical broadening wedge, a pattern that frequently precedes strong directional moves once price escapes the structure.
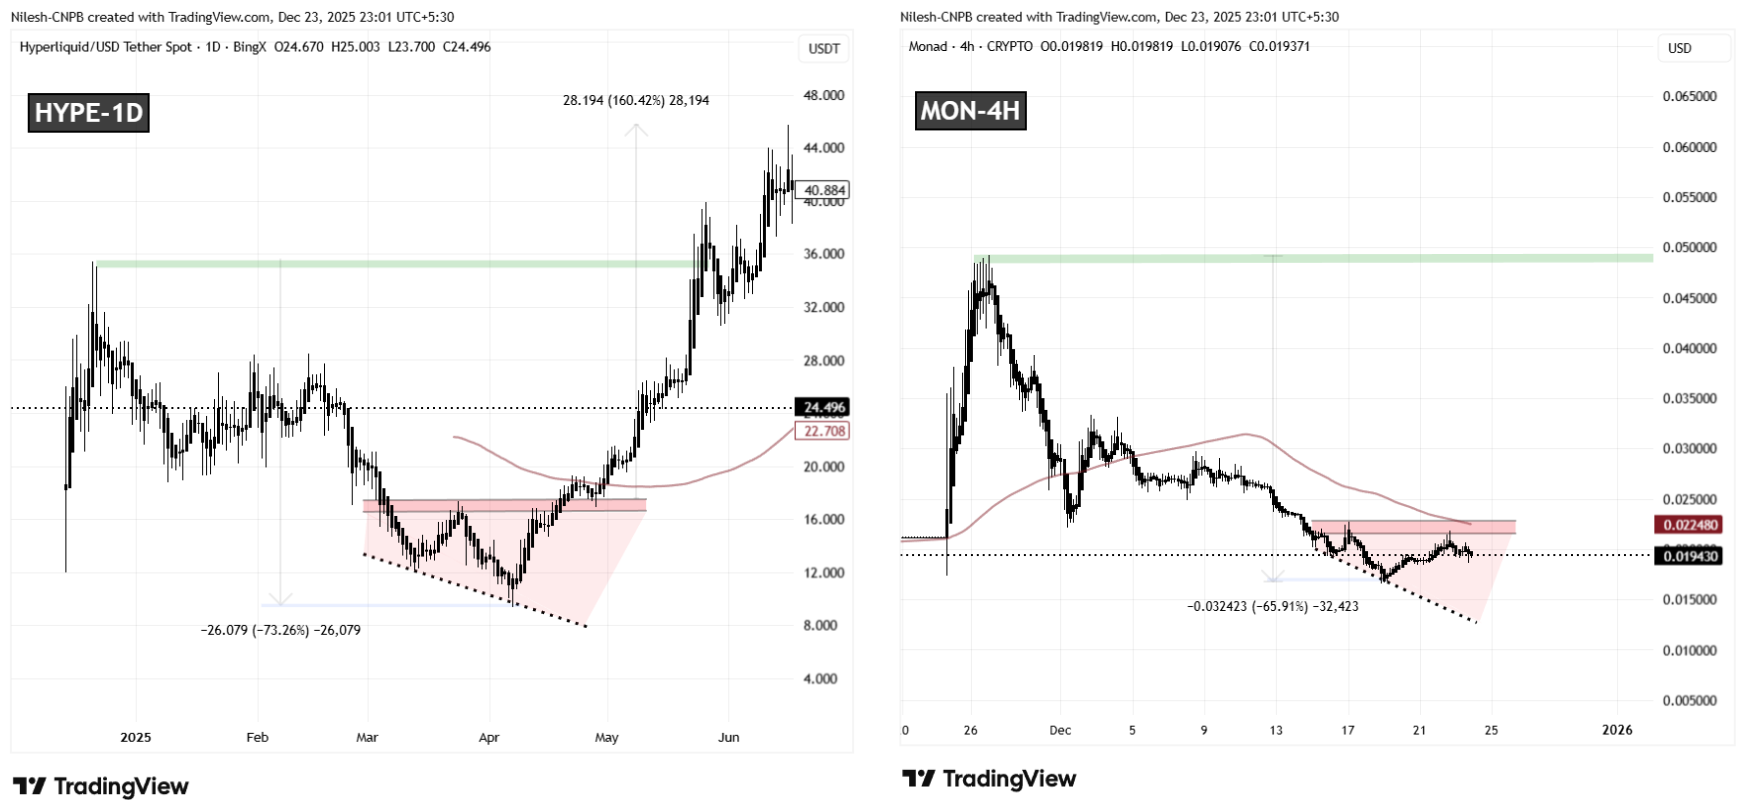
HYPE and MON Fractal Chart/Coinsprobe (Source: Tradingview)
This similarity becomes more compelling when viewed alongside the price behavior around resistance. MON is currently hovering just below a key neckline resistance band between $0.02170 and $0.02268, an area that closely mirrors the zone where HYPE consolidated before its breakout. The alignment between these two structures suggests that MON may be approaching a decision point.
What’s Next for MON?
Despite the growing resemblance to HYPE’s pre-breakout phase, the technical picture has not yet fully shifted in favor of the bulls. Sellers still retain short-term control, and confirmation is needed before a bullish reversal can be considered valid.
For momentum to flip decisively, MON would need to break above the upper boundary of the wedge and reclaim its 100 moving average, which sits near the $0.02248 level. A successful move above this region would signal improving trend strength and increase the probability that the fractal analogy continues to play out.
If such a breakout occurs, the upside potential becomes notable. A sustained bullish reversal could open the door for a broader recovery move toward the $0.049 area, which aligns with MON’s previous all-time high and represents roughly 155% upside from current levels. Until then, price action around resistance will remain critical in determining whether this fractal setup evolves into a full-fledged trend reversal or fails under continued market pressure.
**Disclaimer: **The views and analysis presented in this article are for informational purposes only and reflect the author’s perspective, not financial advice. Technical patterns and indicators discussed are subject to market volatility and may or may not yield the anticipated results. Investors are advised to exercise caution, conduct independent research, and make decisions aligned with their individual risk tolerance.
Disclaimer: The information on this page may come from third parties and does not represent the views or opinions of Gate. The content displayed on this page is for reference only and does not constitute any financial, investment, or legal advice. Gate does not guarantee the accuracy or completeness of the information and shall not be liable for any losses arising from the use of this information. Virtual asset investments carry high risks and are subject to significant price volatility. You may lose all of your invested principal. Please fully understand the relevant risks and make prudent decisions based on your own financial situation and risk tolerance. For details, please refer to
Disclaimer.
Related Articles
'Black Swan' Author Nassim Taleb Believes Elon Musk's X Money is 'Much Smarter' Than Bitcoin - U.Today
Elon Musk's X Money will enter early access in April, with Nassim Taleb praising it as a superior alternative to Bitcoin. He argues it promotes competition in currency issuance, functional daily use, and is backed by a robust infrastructure, unlike volatile cryptocurrencies.
UToday59m ago
ETH 15-minute decline of 0.80%: On-chain large fund flows and DEX selling pressure resonate to trigger a downtrend
2026-03-11 15:00 to 2026-03-11 15:15 (UTC), ETH price briefly and rapidly declined within the range of 2042.35 to 2065.57 USDT, with a K-line return of -0.80% and an amplitude of 1.13%. Market volatility intensified during this period, with significantly increased attention, and short-term market pressure triggered market alertness.
The main driving force behind this anomaly is large-scale on-chain fund flows and sell pressure concentrated on decentralized exchanges (DEX). Monitoring data shows multiple large ETH transfers to trading platforms, suspected to involve institutions or whales.
GateNews1h ago
XRP Price Hints at Bullish Reversal as Negative Funding Rates Build Pressure on Short Sellers
XRP shows potential for a bullish reversal as market indicators align, with negative funding rates possibly triggering a short squeeze. Technical patterns and whale accumulation further support an upward move, indicating a significant price change may be imminent.
CryptometerIo1h ago
Shiba Inu (SHIB) regains momentum as buying pressure reaches the highest level of the month
The price of Shiba Inu (SHIB) is fluctuating around the 0.0000056 USD mark at the time of writing on Wednesday, after rising nearly 7% over the past two days. This recovery trend appears as on-chain indicators and derivatives market data begin to send positive signals. Trading volume is increasing.
TapChiBitcoin2h ago
Goldman Sachs: Hedge fund positioning may create conditions for a rebound in US stocks, with short positions rising to the highest since September 2022
Goldman Sachs report indicates that the structure of hedge fund positions in the US stock market is creating conditions for a market rebound. Speculators maintain long positions while shorting ETFs and futures. Short positions have reached their highest level since September 2022, reflecting market responses to uncertainty. If positive news emerges, it could trigger a rapid market rally.
GateNews2h ago
ETH 15-minute increase of 0.83%: Whales' capital inflow and DeFi lending demand resonate to drive the price
Between 13:30 and 13:45 (UTC) on March 11, 2026, ETH experienced a short-term fluctuation. The candlestick data shows a return of +0.83%, with a price range of 2046.07 to 2082.31 USDT, and an amplitude of 1.77%. Market activity increased during this period, with trading volume significantly higher than the previous cycle, and volatility exceeding the intraday average, attracting widespread market attention.
The main drivers of this fluctuation were the rapid inflow of large on-chain funds and active institutional accounts. Between 13:32 and 13:43,
GateNews2h ago