 Crypto markets love a good rivalry, especially when leadership keeps changing. Hyperliquid price dominated conversations through 2025, while LINK price spent much of that year trying to regain its footing. A fresh shift appears to be forming as 2026 begins, and charts are starting to tell a different story. According to analyst Our Crypto Talk, the balance between HYPE and LINK may already be tilting again.
Hyperliquid entered 2025 with momentum and never really let go. HYPE price surged as the project gained attention in DeFi, managing to outperform LINK price over the year. Our Crypto Talk pointed out that HYPE flipping LINK during 2025 reflected how quickly capital rotated toward newer narratives.
That move mattered because Chainlink has long been viewed as a core DeFi infrastructure name. Hyperliquid price outperforming LINK price signaled that traders were willing to take risk on emerging platforms. Competition from projects like ASTER also made the rally more impressive, since HYPE managed to break through during a crowded period for new protocols.
Why LINK Price Is Showing Strength Going Into 2026
Momentum does not stay one sided forever. Our Crypto Talk highlighted that LINK price has started to reclaim ground in early 2026, even managing to flip HYPE in recent performance. Chainlink price action this week stands out because it held above $10 during a broader downtrend.
Crypto markets love a good rivalry, especially when leadership keeps changing. Hyperliquid price dominated conversations through 2025, while LINK price spent much of that year trying to regain its footing. A fresh shift appears to be forming as 2026 begins, and charts are starting to tell a different story. According to analyst Our Crypto Talk, the balance between HYPE and LINK may already be tilting again.
Hyperliquid entered 2025 with momentum and never really let go. HYPE price surged as the project gained attention in DeFi, managing to outperform LINK price over the year. Our Crypto Talk pointed out that HYPE flipping LINK during 2025 reflected how quickly capital rotated toward newer narratives.
That move mattered because Chainlink has long been viewed as a core DeFi infrastructure name. Hyperliquid price outperforming LINK price signaled that traders were willing to take risk on emerging platforms. Competition from projects like ASTER also made the rally more impressive, since HYPE managed to break through during a crowded period for new protocols.
Why LINK Price Is Showing Strength Going Into 2026
Momentum does not stay one sided forever. Our Crypto Talk highlighted that LINK price has started to reclaim ground in early 2026, even managing to flip HYPE in recent performance. Chainlink price action this week stands out because it held above $10 during a broader downtrend.
@ourcryptotalk / X
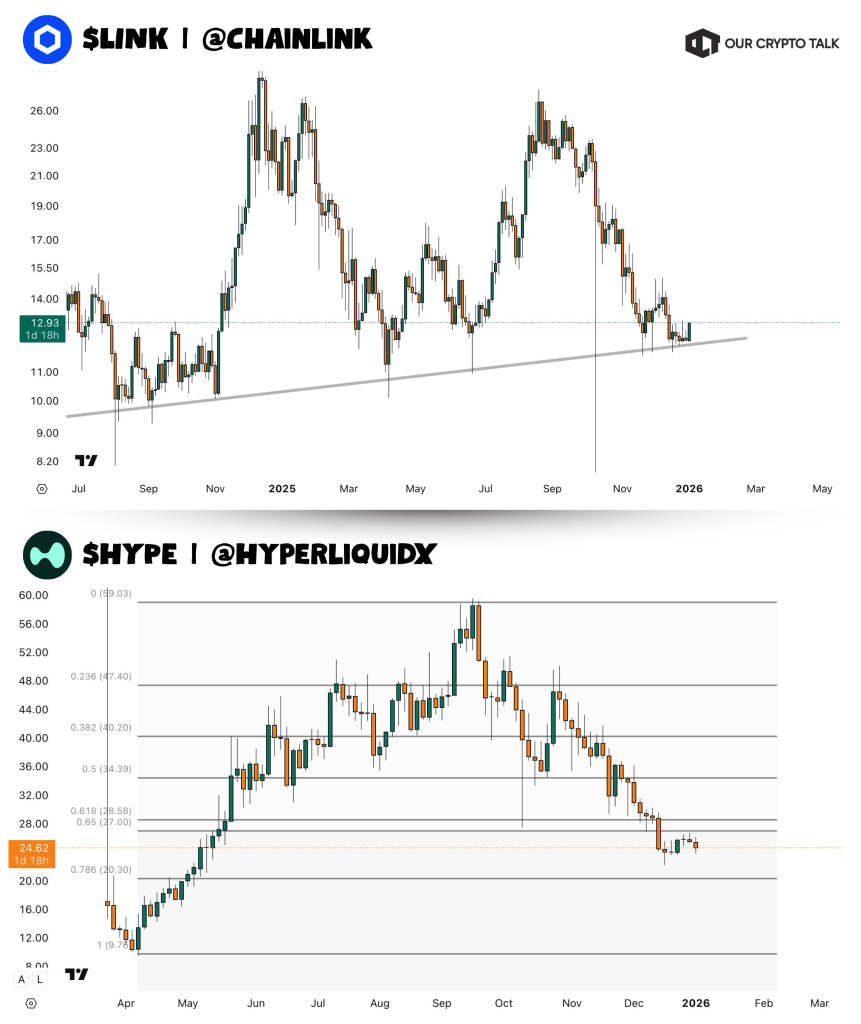
Charts shared by Our Crypto Talk show LINK printing a green candle on the 3-day timeframe, a sign that buyers stepped in at a level that has mattered for nearly 2 years. That trendline support continues to hold, giving Chainlink price a more stable structure compared to HYPE price at the moment.
HYPE price is not breaking down, though the structure looks less convincing short term. Our Crypto Talk noted that Hyperliquid is still trying to flip a golden pocket resistance into solid support. Price rejection at that zone has limited follow-through so far.
That rejection does not erase the gains from 2025. HYPE price still reflects a successful breakout year and remains relevant within the DeFi conversation. Chart behavior suggests that Hyperliquid may need more time before the next sustained move develops.
Chainlink continues to benefit from its long-standing role within institutional-focused infrastructure. Our Crypto Talk emphasized that this angle often gives LINK an edge when market conditions shift toward stability and structure.
Large cap context also matters here. LINK and HYPE both sit within a size range where capital rotation can happen without extreme volatility. Chainlink price holding long term support levels reinforces its appeal during periods when traders prioritize reliability over hype driven momentum.
Read Also: Ethereum Price to $10k in 2026? This Long-Term ETH Chart Says the Setup Is Already in Place
Why The HYPE And LINK Battle Still Matters In 2026
Leadership changes between Hyperliquid price and LINK price highlight how dynamic DeFi remains. Our Crypto Talk described this rivalry as one worth watching because each flip reflects where confidence is moving.
Both projects could perform well through 2026 given their scale and relevance. Current price action favors LINK, though HYPE remains a strong contender after its 2025 run. Watching how these charts evolve may offer useful context for understanding where DeFi attention flows next.
Markets rarely move in straight lines, and this back and forth between HYPE and LINK shows how quickly narratives can shift. The coming months may reveal whether Chainlink price continues to build on this structure or whether Hyperliquid price finds another breakout moment.
Disclaimer: The information on this page may come from third parties and does not represent the views or opinions of Gate. The content displayed on this page is for reference only and does not constitute any financial, investment, or legal advice. Gate does not guarantee the accuracy or completeness of the information and shall not be liable for any losses arising from the use of this information. Virtual asset investments carry high risks and are subject to significant price volatility. You may lose all of your invested principal. Please fully understand the relevant risks and make prudent decisions based on your own financial situation and risk tolerance. For details, please refer to
Disclaimer.
Related Articles
Bitcoin Holds Strong at $70,000! On-Chain Data Reveals "Collective Selling Wave," Retail Investors Emerge as Biggest Selling Pressure
Against the backdrop of Middle East geopolitical tensions, Bitcoin has faced a comprehensive sell-off with nearly all coin holders turning to net selling, most notably among retail investors. According to Glassnode data, the cumulative trend score has dropped to 0.04, indicating heavy selling pressure in the market. Small-cap holders and mid-sized investors are showing significant selling intensity, while whales, though reducing their holdings, are doing so at a lower rate. Despite the dismal data, Bitcoin continues to demonstrate resilience against declines.
区块客5m ago
CryptoQuant: Bitcoin and Gold Correlation Falls to Nearly 4-Year Low, Showing Clear Divergence in Trends
The correlation between Bitcoin and gold has fallen to its lowest level since November 2022, showing a clear divergence in their trajectories. Despite Bitcoin's recent rebound to $70,000, bearish pressure is intensifying, and investors need to monitor key support levels and gold price movements to gauge market direction.
GateNews17m ago
XRP breaks through $1.5 neckline, key EMA resistance determines short-term trend, potential to test $2
XRP recently broke through the $1.5 resistance level, creating a new closing high. Analysts point out that the short-term support level is at $1.5, which needs to hold to continue the uptrend. If this level breaks, the $1.42 support can be referenced as an alternative. A breakout above three EMAs is needed to confirm a bullish reversal. Market participants should pay attention to price movement and changes in technical indicators.
GateNews32m ago
Hyperliquid Price Jumps 22% as Commodity Trading Hits Record
Key Insights:
Hyperliquid surged over 20% weekly, driven by record commodity futures trading volumes, especially oil and silver contracts, gaining strong traction among traders.
Whale activity surpassed $3.6 billion in leveraged positions, boosting liquidity and reinforcing upward momentum a
CryptoFrontNews35m ago
Bitcoin Falls Below $70,000: PPI Exceeds Expectations + Powell's Hawkish Stance, Rate Cut Expectations Dampened
On March 19, Bitcoin pulled back to a key support zone due to unexpected U.S. inflation data and hawkish signals from Federal Reserve Chair Powell, declining over 4.6% and currently trading near $70,800. Market expectations for rate cuts have cooled, with the total crypto market cap declining to approximately $2.51 trillion and sentiment remaining cautious. If Bitcoin breaks below $70,000, it could potentially decline further to $65,000. Market momentum is highly dependent on macroeconomic factors.
GateNews41m ago
Bitcoin Fails to Break Higher: Why the $70,000 Level Remains Elusive? Key Indicators Reveal Upside Concerns
Bitcoin recently briefly broke through $74,000 but pulled back to around $70,800 due to selling pressure from short-term holders. While the price shows an upward trend, it faces structural resistance, and the current movement appears more like a bear market rally rather than the start of a bull market. Without effectively resisting selling pressure, it could break below the $70,000 support level. The market is still waiting for clearer signals.
GateNews49m ago
