Bitcoin (BTC) is currently trading around $90,022, as the bulls are trying to regain control by pushing the price above the important psychological level of $90,000. However, BTC’s long-term outlook still makes investors cautious. On the Polymarket market, the probability of Bitcoin reaching $150,000 before 2027 is only 21%, reflecting rather conservative expectations for 2026.
Sharing on the Milk Road program, Mr. Julio Moreno – Head of Research at CryptoQuant – stated that Bitcoin officially entered a bear market from early November and has not yet shown clear signs of recovery. According to Moreno, based on the realized price and historical cycles, BTC is likely to bottom out in the $56,000–$60,000 range.
This view also aligns with the opinion of veteran Bitcoin investor Michael Terpin. He forecasts BTC may bottom around $60,000 in Q4/2026 and considers this an attractive buying opportunity. Terpin believes the next halving could trigger a “supply shock,” thereby activating a strong rally in 2028–2029.
So, are Bitcoin and the top altcoins ready for a significant recovery? Let’s analyze the charts of the 10 largest cryptocurrencies to find the answer.
Technical Analysis of BTC
Bitcoin has been trading within a narrow range from $86,400 to $90,600 in recent days. Usually, such tight accumulation phases lead to a strong breakout.
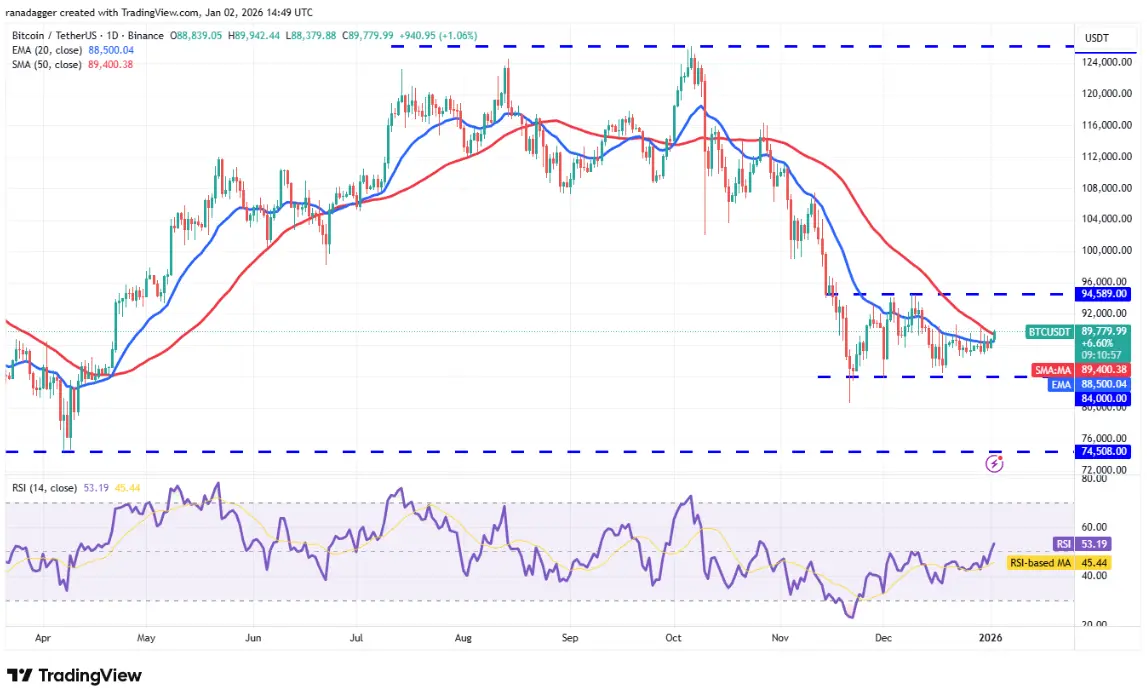 Daily BTC/USDT Chart | Source: TradingView The 20-day EMA is moving sideways around $88,500, with the RSI oscillating near the midpoint, indicating that supply and demand are in balance.
If the bulls push the price above $90,600, the BTC/USDT pair could rise to $94,589. This is a key resistance level that the bears need to defend, because if the price closes above this level, Bitcoin could move towards $100,000 and beyond to $107,500.
Conversely, the bears will gain the advantage if the price turns down and breaks below $86,400, increasing the risk of a breakdown below the support zone at $84,000.
Technical Analysis of ETH
Ether (ETH) is still oscillating within an symmetrical triangle pattern, reflecting market indecision about the next trend.
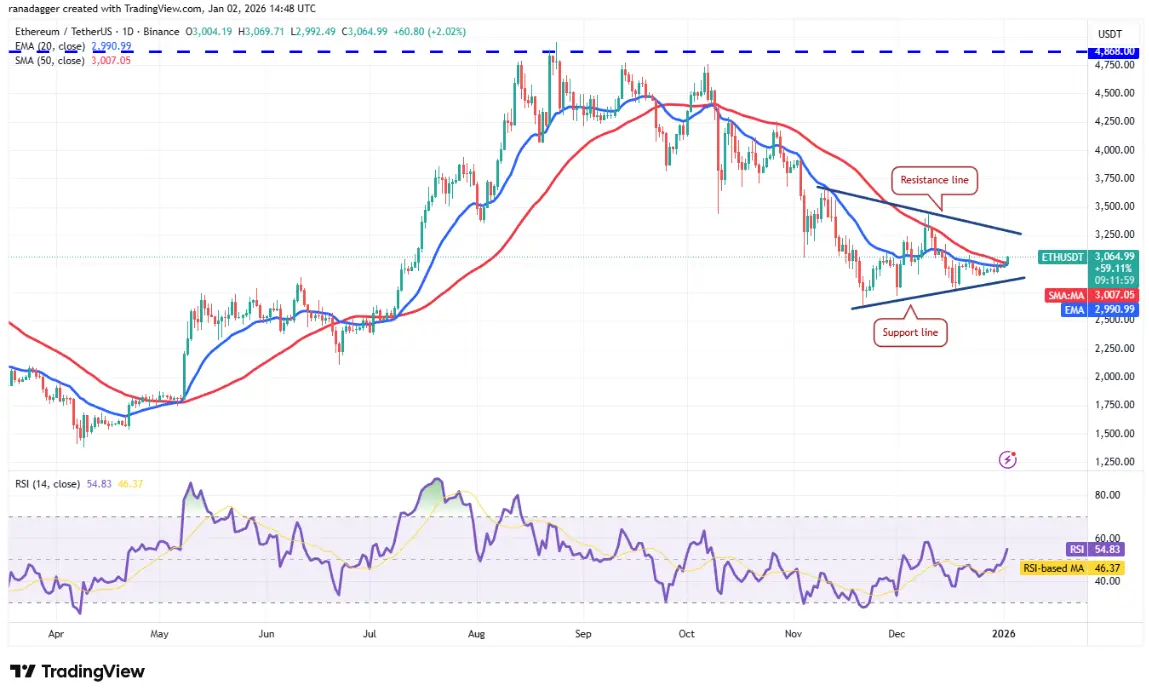 Daily ETH/USDT Chart | Source: TradingView If the price closes above the 50-day SMA at $3,007, the ETH/USDT pair could rise to the resistance line of the pattern. The bears are expected to defend this level vigorously, because if it breaks, ETH could open the way for an upward move toward $4,000.
In the opposite scenario, if the price reverses downward from the resistance line, it indicates ETH may continue to be trapped within the triangle. The bears will regain control if the price closes below the support line.
Technical Analysis of BNB
The bears are trying to defend the 50-day SMA at $873, but a positive sign is that the BNB bulls are still maintaining upward pressure.
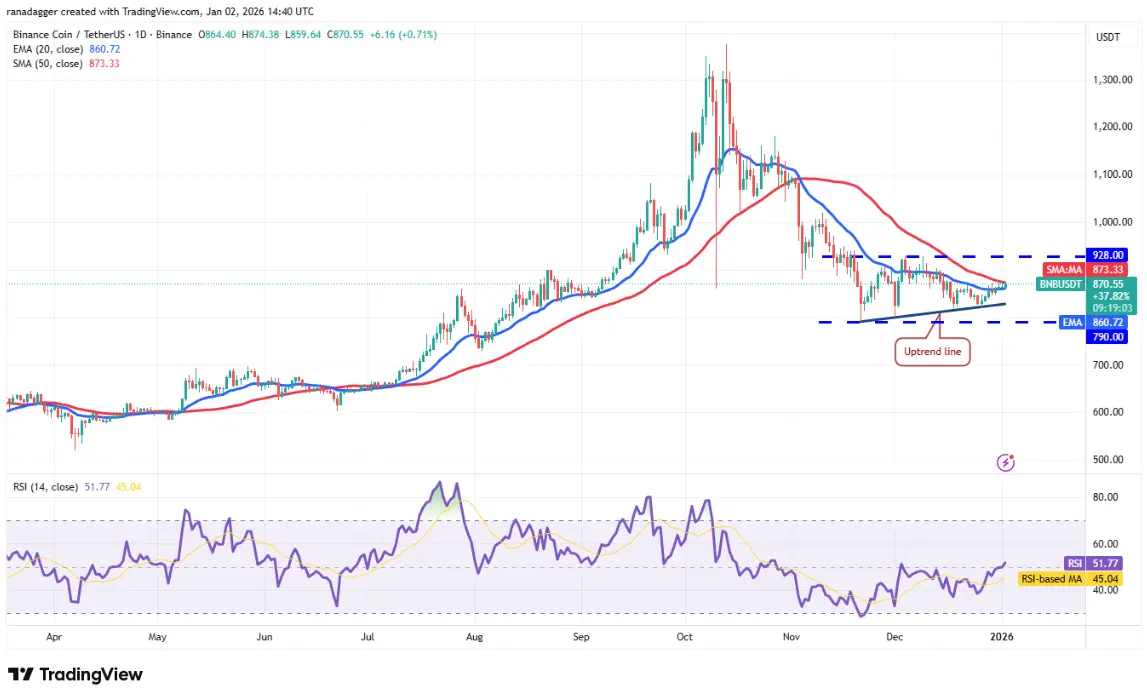 Daily BNB/USDT Chart | Source: TradingView This increases the likelihood of the price moving up to the $928 zone, where the bears are likely to intervene. If the bulls overcome this barrier, the BNB/USDT pair will complete a bullish triangle pattern, with a target up to $1,066 based on the pattern.
On the other hand, if BNB reverses downward and breaks below the upward trendline, it indicates the bulls have given up. A new decline could then begin if the price closes below $790.
Technical Analysis of XRP
XRP has been closely following the 20-day EMA at $1.90 in recent days, increasing the potential for a breakout upward.
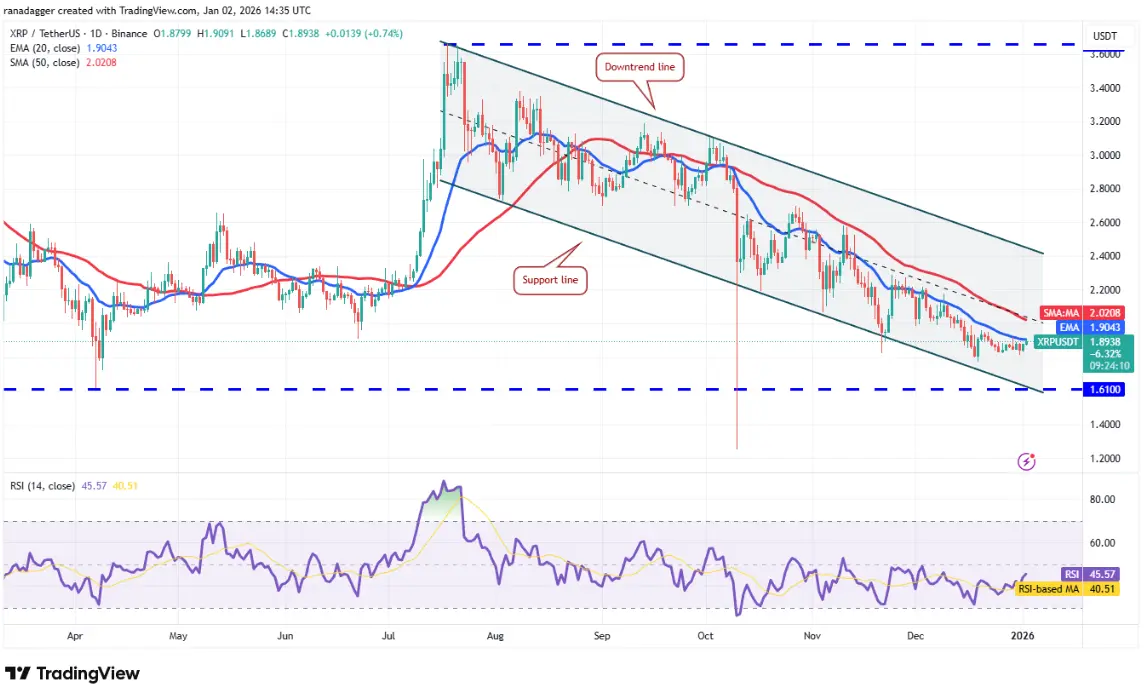 Daily XRP/USDT Chart | Source: TradingView If this occurs, the XRP/USDT pair could rise to the downward trendline. Although there is resistance at the 50-day SMA at $2.02, it is likely to be surpassed. However, the bears are expected to defend strongly at the downward trendline. If the price drops sharply from here, XRP may continue to fluctuate within the channel for some time.
Conversely, the $1.61 level is a key support zone. If broken, XRP could enter a new downtrend, heading toward the October 10 low around $1.25.
Technical Analysis of SOL
Solana (SOL) has risen to the 50-day SMA at $131. However, the long wick indicates that the bears are defending this zone very aggressively.
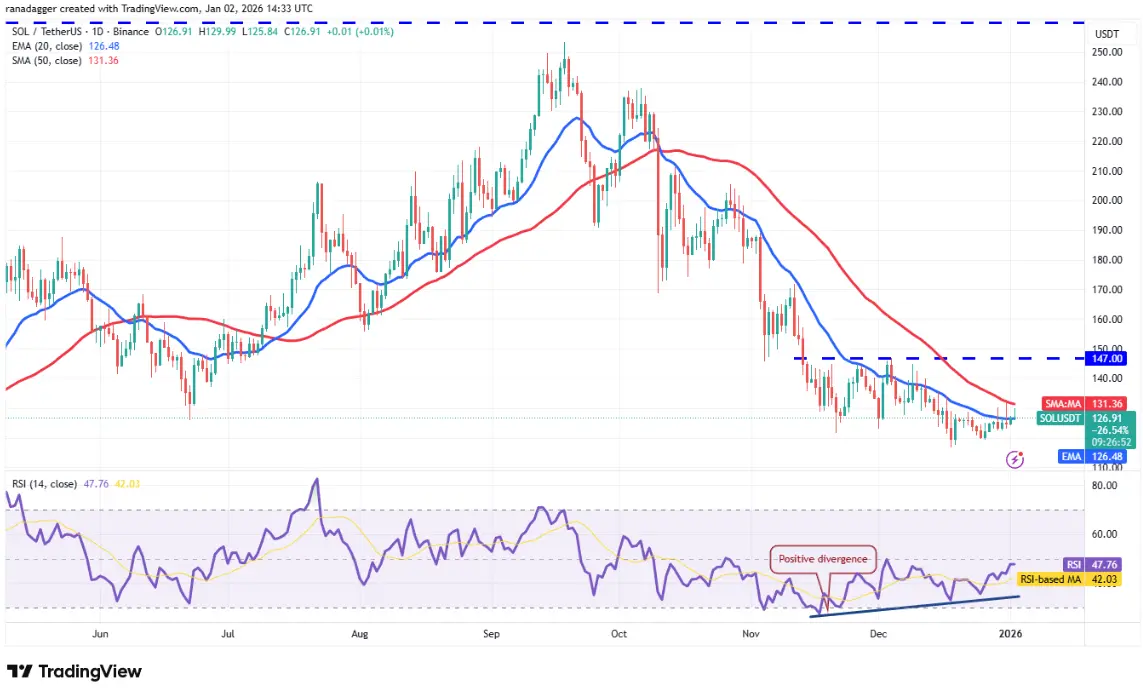 Daily SOL/USDT Chart | Source: TradingView Nonetheless, positive divergence on the RSI suggests selling pressure is weakening. The bulls will continue to attempt to push the price above the 50-day SMA. If successful, the SOL/USDT pair could rise to $147.
Conversely, if the price reverses downward from the moving averages and breaks below $116, it indicates the bears still control the market. In that case, SOL could fall to $108 and then to $95.
Technical Analysis of DOGE
Dogecoin (DOGE) fell below $0.12 on Wednesday but the bears could not sustain the decline.
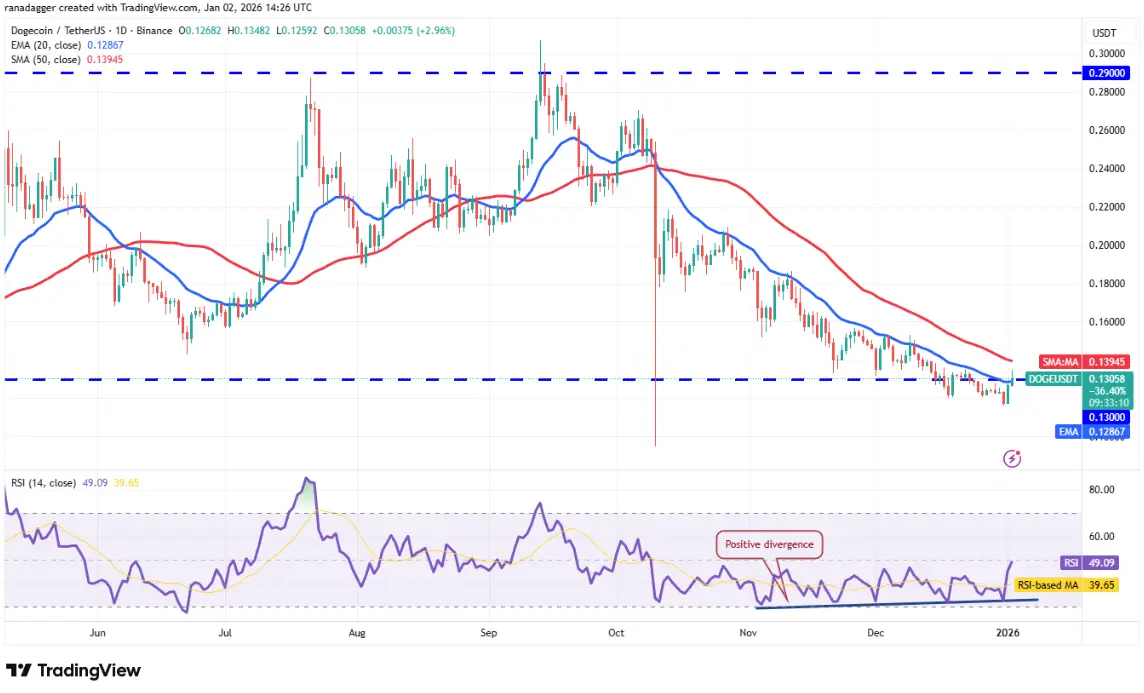 Daily DOGE/USDT Chart | Source: TradingView The bulls pushed the price back above the breakout zone of $0.13 on Thursday but are struggling to hold higher levels. If the price reverses downward and breaks below $0.12, it indicates the bears have turned the $0.13 level into resistance. Then, the DOGE/USDT pair could slide back to the October 10 low around $0.10.
On the other hand, if the price rebounds and breaks above the 50-day SMA at $0.14, it shows the market has rejected the previous breakdown. Dogecoin could then advance toward the $0.16 zone.
Related Articles
Bitcoin and S&P 500 Surged, Oil Plunged as Iran Says It’s Ready to End the War
Financial markets experienced significant volatility with Bitcoin reaching $68,500 amid reports of Iran's President Pezeshkian expressing willingness to end conflict with the US, contingent on guarantees. US stocks surged, while oil prices fell sharply.
CryptoPotato3m ago
Bitfarms Rebrands to Keel, Plans to Sell Bitcoin for AI Pivot
Bitfarms Ltd. (Nasdaq/TSX: BITF) announced on March 31, 2026 that shareholders have approved the company’s redomiciliation from Canada to the United States and rebrand to Keel Infrastructure, effective April 1, 2026, as part of a strategic transformation from a pure-play Bitcoin miner to a North American digital infrastructure company focused on AI and high-performance computing.
CryptopulseElite5m ago
CoinShares moved out 10,720 BTC over the past two days, setting a record high for total outflows.
Gate News update: On April 1, according to on-chain data monitoring, digital asset management firm CoinShares transferred 10,720 BTC to new wallets over the past two days (worth approximately $720 million), setting its all-time largest outflow.
GateNews5m ago
Groundwork For Potential Bitcoin Recovery Is Forming, Say Analysts
Bitcoin remains firmly in the middle of its almost two-month-long sideways channel following weekend declines, during which it dumped below $66,000 briefly.
“Momentum remains tentative, with lower highs still defining the short-term structure,” commented on-chain analytics provider Coinglass on
CryptoPotato6m ago
Bitcoin, stocks rally on hopes of US-Israel-Iran war ending
Bitcoin briefly touched a fresh intra-day high near $68,589 as markets absorbed a mix of geopolitics and macro signals. The move came alongside a broad risk-on rally in U.S. equities, with the Dow Jones Industrial Average climbing more than 1,125 points, the S&P 500 rising around 2.9%, and the
CryptoBreaking8m ago
Bitcoin’s Community Faces Risk From Quantum Computers: Caltech Says the Threat Could Arrive Sooner Than Expected
Recent research indicates that fault-tolerant quantum computers capable of breaking encryption could emerge sooner than expected. This poses a significant threat to the security mechanisms of Bitcoin and Ethereum, which rely on cryptographic algorithms to protect transactions and assets. As quantum technology advances, the cryptocurrency community must monitor developments closely and proactively prepare new encryption methods to mitigate potential risks.
TapChiBitcoin39m ago
