Over the past 24 hours, the MYX Finance price has experienced a explosive surge, soaring nearly 87% at its peak. This movement occurs amid growing expectations for the MYX Finance V2 version, which promises to enable users to launch the perpetual trading market immediately, thereby driving a strong wave of speculation in the market.
MYX Holders Play a Leading Role
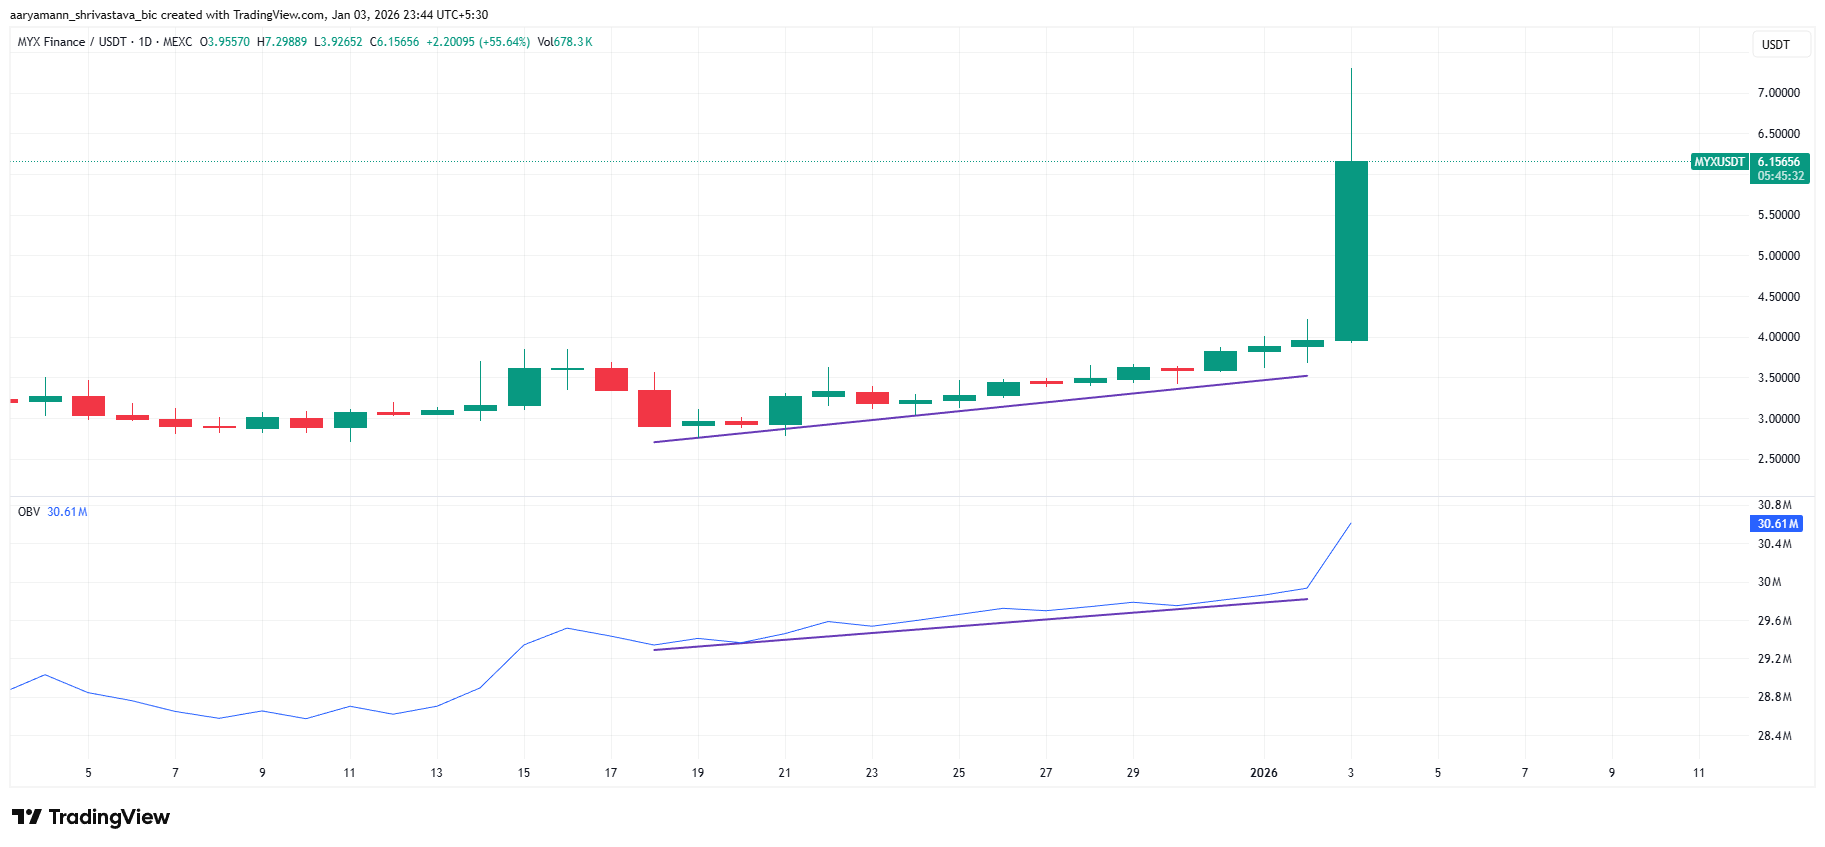
On-chain indicators and trading volume suggest that MYX Finance’s upward momentum is supported by genuine demand rather than just short-term speculation. The On-Balance Volume (OBV) indicator has recorded a sharp increase alongside the price, after several consecutive accumulation sessions. This reflects a sustainable accumulation process by investors before the price breakout.
This gradual accumulation indicates increasing confidence among buyers. As the price begins to accelerate, trading volume also rises significantly, confirming broad market participation. The alignment of MYX price and OBV often signals a healthy uptrend, with capital inflows helping the trend to continue rather than reversing suddenly due to low liquidity.
 MYX OBV | Source: TradingView
Stable trading volume expansion helps reduce the immediate risk of exhaustion. Buyers are willing to trade at higher prices, reinforcing confidence in MYX Finance’s growth prospects. This development shows that the current rally is not solely based on sentiment but is also driven by genuine market participation.
MYX OBV | Source: TradingView
Stable trading volume expansion helps reduce the immediate risk of exhaustion. Buyers are willing to trade at higher prices, reinforcing confidence in MYX Finance’s growth prospects. This development shows that the current rally is not solely based on sentiment but is also driven by genuine market participation.
MYX Finance: Facing the Danger Zone
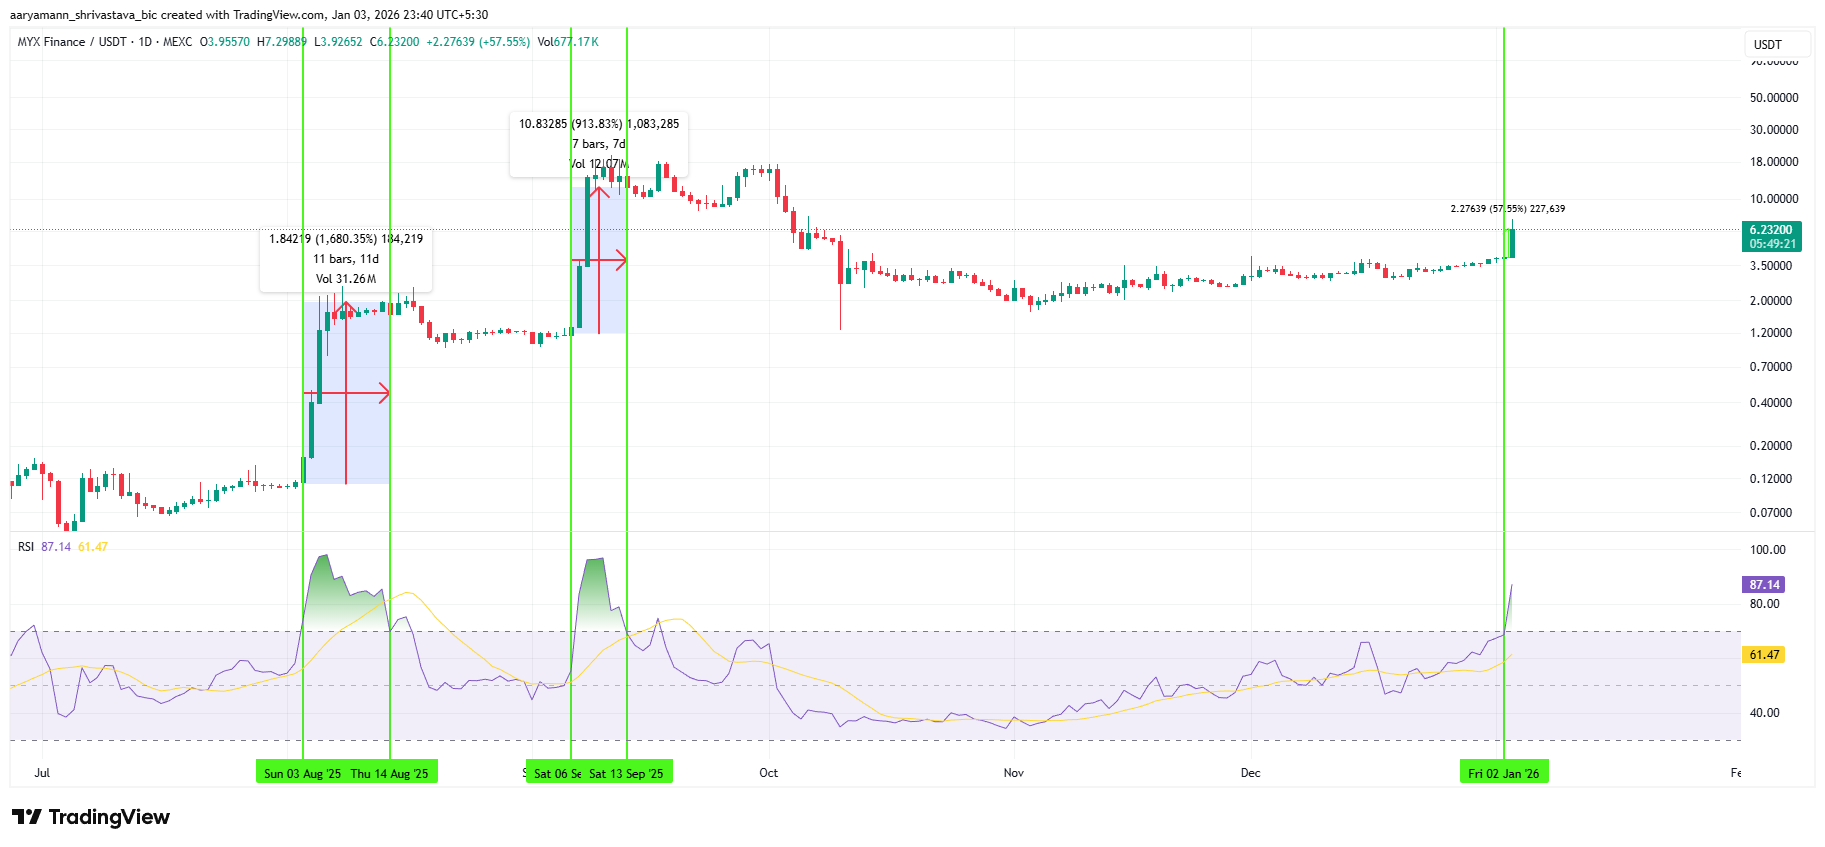
Momentum indicators issue certain warnings but also provide insights into the market context. The RSI has surpassed the 70 threshold, placing MYX in overbought territory – often a sign of potential short-term correction as investors take profits.
However, history shows that MYX Finance has maintained strong upward momentum even when in overbought conditions. In August 2025, MYX increased by up to 1,680% without significant correction. Similarly, in September 2025, it experienced over a 913% increase amid prolonged overbought conditions.
 MYX RSI | Source: TradingView
These precedents indicate that RSI is not always a definitive sign of an end to MYX’s rally. During periods driven by strong growth narratives, momentum can remain high for extended periods. The current RSI reflects the market’s intrinsic strength rather than a certain reversal signal.
MYX RSI | Source: TradingView
These precedents indicate that RSI is not always a definitive sign of an end to MYX’s rally. During periods driven by strong growth narratives, momentum can remain high for extended periods. The current RSI reflects the market’s intrinsic strength rather than a certain reversal signal.
MYX Finance: Breakout Power
In the past 24 hours, MYX price has increased over 87% at its peak, trading around $6.12 at present. This rally has pushed MYX above the $7.00 level in a short period – the highest price in the past three months, indicating renewed market interest. At the same time, MYX has broken out of a more-than-two-month-long ascending channel pattern.
Technical and momentum indicators both suggest that the uptrend could continue if a solid support zone is established. Maintaining the $7.00 level as a stable support is the next key target. If successful, MYX could extend its rally toward the $8.90 zone, with $10.00 becoming the next psychological target.
 MYX Price Analysis | Source: TradingView
However, downside risks remain if profit-taking activity intensifies. Many investors have waited months for a favorable exit opportunity. If a large sell-off occurs, MYX could drop below $5.83. Losing this level would weaken the bullish structure and potentially bring MYX down to the $4.54 zone, invalidating the current growth thesis.
MYX Price Analysis | Source: TradingView
However, downside risks remain if profit-taking activity intensifies. Many investors have waited months for a favorable exit opportunity. If a large sell-off occurs, MYX could drop below $5.83. Losing this level would weaken the bullish structure and potentially bring MYX down to the $4.54 zone, invalidating the current growth thesis.
Disclaimer: The information on this page may come from third parties and does not represent the views or opinions of Gate. The content displayed on this page is for reference only and does not constitute any financial, investment, or legal advice. Gate does not guarantee the accuracy or completeness of the information and shall not be liable for any losses arising from the use of this information. Virtual asset investments carry high risks and are subject to significant price volatility. You may lose all of your invested principal. Please fully understand the relevant risks and make prudent decisions based on your own financial situation and risk tolerance. For details, please refer to
Disclaimer.
Related Articles
Will XRP Hold $1.33 or Extend Toward $1.30 Before Rebound?
XRP is currently trading at $1.35, experiencing a 1.3% decline. Key support is at $1.34, while resistance is at $1.40. The price is testing around the Fibonacci levels of $1.33 and $1.30, crucial for potential upward movement or deeper decline.
CryptoNewsLand3h ago
Dogecoin Monthly Breakdown Pattern Reappears as Price Tests $0.0918
Dogecoin is currently trading at $0.09205 at a gain of 2.3, with support of above $0.08878.
As can be seen in the monthly chart, there are recurring breakdown areas that have been followed by significant expansions in price.
The short-term trading range is narrow and the immediate point o
CryptoNewsLand3h ago
Solana Nears $95 Resistance With $17B Volume Surge
Solana approaches a key resistance level near $95, with increased trading volume and open interest signaling active trader interest. The token is currently at $90.20, facing potential upward movement if it surpasses $95, but may test $85 if rejected.
CryptoFrontNews4h ago
Bitcoin Slips to $68,000 as Middle East Conflict and US Jobs Data Trigger Sell-Off
Bitcoin surrendered its $70,000 support level, triggering a broader crypto market retreat that wiped out $329 million in leveraged positions. This downturn was fueled by a perfect storm of geopolitical and macroeconomic pressures.
Wiping out the ‘War Gains’
Bitcoin’s midweek resilience
Coinpedia4h ago
PEPE Hovers at Critical $0.053414 Support as $432M Volume Surge Tightens Breakout Watch
PEPE is trading at $0.053416, just above support at $0.053414, with significant trading volume up 22.14%. Resistance is at $0.053676. Despite a slight decrease in price, there’s increased market activity, suggesting potential volatility.
CryptoNewsLand4h ago
DXY Retest at 99.183: Will 100–101 Break as US Degen Index Stabilizes?
DXY trades at 99.183 while retesting the 100–101 monthly resistance zone.
US Degen Index 6900 sits at $0.0001197 with support at $0.0001175 and resistance at $0.0001214.
A break above 101 on DXY would shift structure higher, while rejection keeps price below key resistance.
The U.
CryptoNewsLand4h ago