Cardano (ADA) is maintaining a solid sideways trend around the $0.40 mark as of Monday, after the price convincingly closed above the descending channel pattern last week. The developments in the derivatives market reflect a clear improvement in sentiment, as the open interest (OI) of ADA increased, along with a rise in long positions within the trader community.
Positive Sentiment for Cardano in the Derivatives Market
Data from CoinGlass shows that the open interest (OI) of Cardano futures contracts on exchanges surged to $851.17 million on Monday, up from $644.34 million recorded the previous Tuesday, setting the highest level since mid-December. The strong increase in OI indicates that new capital is actively flowing into the market, reflecting growing demand and potentially serving as a key catalyst, fueling the current bullish trend of ADA.
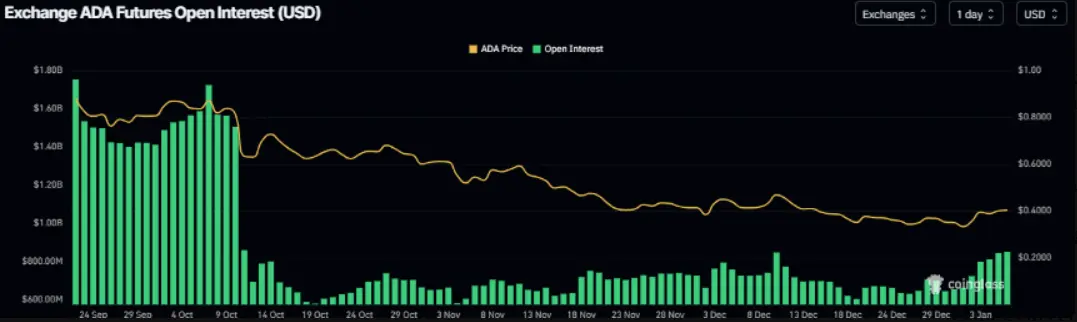 Source: CoinGlass
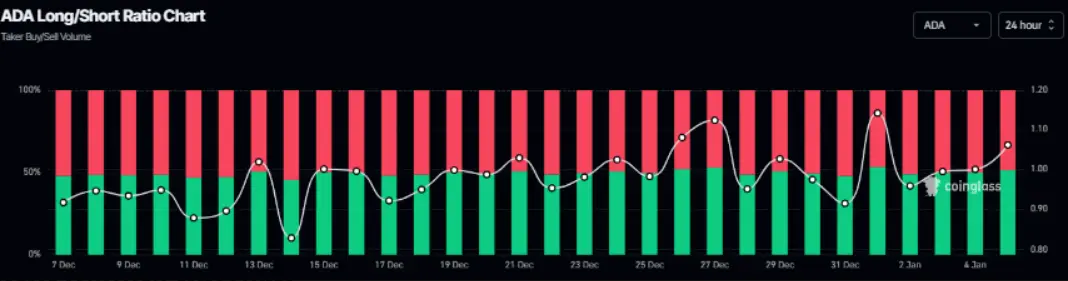
Alongside this, the long/short ratio of Cardano on CoinGlass has also continuously improved, reaching 1.06 on Monday, approaching the highest level of the month. The ratio surpassing 1 suggests that optimistic sentiment is prevailing, as more traders are betting on ADA’s price continuing to rise in the near future.
Source: CoinGlass
Alongside this, the long/short ratio of Cardano on CoinGlass has also continuously improved, reaching 1.06 on Monday, approaching the highest level of the month. The ratio surpassing 1 suggests that optimistic sentiment is prevailing, as more traders are betting on ADA’s price continuing to rise in the near future.
 Source: CoinGlass
Cardano Price Forecast: ADA closes above the channel pattern
The price of Cardano has made an impressive breakout by closing above the upper trendline of the descending channel pattern—a technical structure formed since mid-October by connecting significant peaks and troughs. This upward momentum was maintained gently until Sunday, with ADA trading around the $0.40 level at the start of the week.
In a positive scenario, if Cardano maintains its current momentum, the price could extend its recovery toward the nearest resistance zone at $0.42, coinciding with the 50-day exponential moving average (EMA). A daily close above this level would act as a catalyst, paving the way for further gains toward the important resistance zone at $0.49.
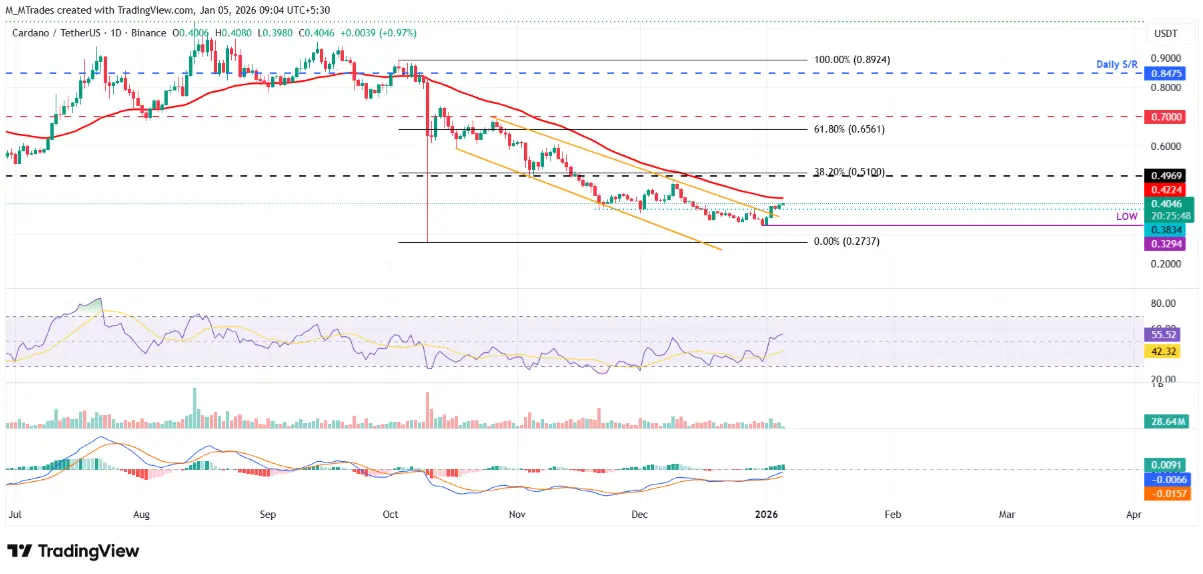 Daily ADA/USDT Chart | Source: TradingView
Technical indicators also support the bullish trend. The Relative Strength Index (RSI) on the daily timeframe is at 55, surpassing the neutral 50 level, indicating that buying pressure is gradually gaining dominance. Meanwhile, the MACD has issued a bullish crossover signal, with expanding green histogram bars above the neutral line, further strengthening the optimistic outlook.
Daily ADA/USDT Chart | Source: TradingView
Technical indicators also support the bullish trend. The Relative Strength Index (RSI) on the daily timeframe is at 55, surpassing the neutral 50 level, indicating that buying pressure is gradually gaining dominance. Meanwhile, the MACD has issued a bullish crossover signal, with expanding green histogram bars above the neutral line, further strengthening the optimistic outlook.
However, if profit-taking pressure emerges, ADA still faces the risk of correction and could retreat to the nearest support zone around the recent low at $0.32.
SN_Nour
Disclaimer: The information on this page may come from third parties and does not represent the views or opinions of Gate. The content displayed on this page is for reference only and does not constitute any financial, investment, or legal advice. Gate does not guarantee the accuracy or completeness of the information and shall not be liable for any losses arising from the use of this information. Virtual asset investments carry high risks and are subject to significant price volatility. You may lose all of your invested principal. Please fully understand the relevant risks and make prudent decisions based on your own financial situation and risk tolerance. For details, please refer to
Disclaimer.
Related Articles
BTC rises 0.52% in 15 minutes: Major capital net inflows to exchanges and multiple market resonance driving the move
2026-03-20 21:15 to 21:30 (UTC), BTC recorded +0.52% return in 15 minutes, with a price range of 70124.0 to 70586.6 USDT, and amplitude of 0.66%. This round of volatility occurred against a backdrop of increased market attention and heightened fluctuations, with both on-chain and market participants showing highly active behavior.
The main driver of this volatility was whale funds (entities holding >=1,000 BTC) making a net inflow of 4,091.39 BTC to exchanges within 24 hours, data significantly exceeding the average for the same period. Concentrated net inflows
GateNews21m ago
Bitcoin Has Stabilized, But Investors Are Paying Up for Downside Protection: VanEck
Bitcoin's volatility has decreased to around $70,000, but traders are still heavily investing in downside protection. Although premiums for puts have dropped, they remain high historically, suggesting caution among investors. This defensiveness may signal an impending price bottom, as similar market conditions in the past have led to recoveries.
Decrypt1h ago
Cardano Flashes Weekly Buy Signal As ADA Holds Key $0.23 Support
Cardano is trying to shake off a bruising stretch of price weakness, and a fresh technical signal is giving traders a reason to pay attention again. Crypto analyst Ali Martinez said ADA has printed a TD Sequential buy signal on the weekly chart, showing a “black 9” that often appears when a
BlockChainReporter2h ago
Ethereum Approaches Cycle Low as Bitmain Indicates Violent Belief
The article explores Ethereum's potential market bottom, highlighting its correlation with past S&P 500 trends and significant institutional investment by Bitmain. Despite mixed market sentiment, historical patterns suggest possible recovery.
CryptoBreaking4h ago
Analyst: If Bitcoin falls below the $66,000 support level, it may trigger a 10%-20% correction
Gate News reported that on March 20, Chartered Market Technician (CMT) Aksel Kibar stated on March 21 that the lower support boundary of Bitcoin's potential rising wedge formation is located at 66,000, and a breakdown below this level could trigger a bearish reversal. Aksel Kibar pointed out that rising wedges, as a classic technical pattern, typically appear at the end of uptrends, signaling price momentum exhaustion. Historical data shows that after similar downside breakdowns are confirmed, the average pullback ranges from 10%-20%.
GateNews5h ago
