
**Date: **Sat, Jan 03, 2026 | 04:25 PM GMT
As 2026 kicks off, the broader cryptocurrency market is showing renewed stability. Ethereum (ETH) has reclaimed the $3,100 level, and momentum is gradually rotating into select altcoins — including World Liberty Financial (WLFI).
WLFI has jumped nearly 9% on the day, extending its weekly gains to around 16%, but the more important development is unfolding on the chart. On lower timeframes, price action is forming a well-defined bullish structure, suggesting that the token may be gearing up for a meaningful breakout if key levels are reclaimed.
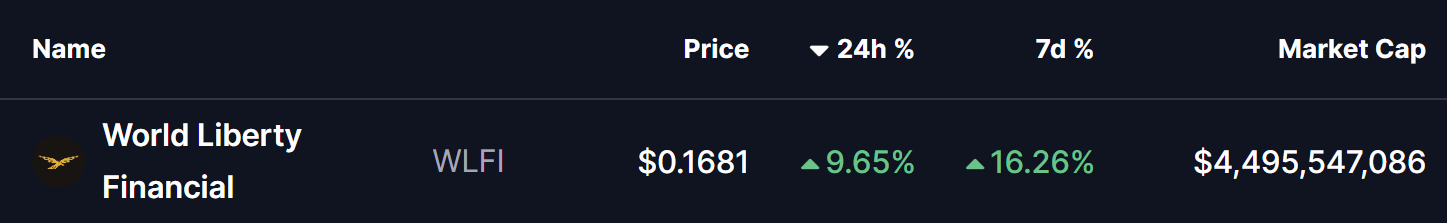
Source: Coinmarketcap
Ascending Triangle In Play
On the 4-hour chart, WLFI is forming a clear ascending triangle, characterized by a series of higher lows pushing steadily into a flat resistance zone. This pattern is widely viewed as a bullish continuation setup, especially when it develops during a prolonged consolidation phase accompanied by consistent dip-buying.
WLFI recently faced rejection near the $0.1741 resistance zone, which capped multiple upside attempts. That rejection pushed price back toward the rising support trendline, with buyers stepping in around the $0.1222 region. Importantly, each pullback has been shallower than the last, reinforcing the presence of strong underlying demand.
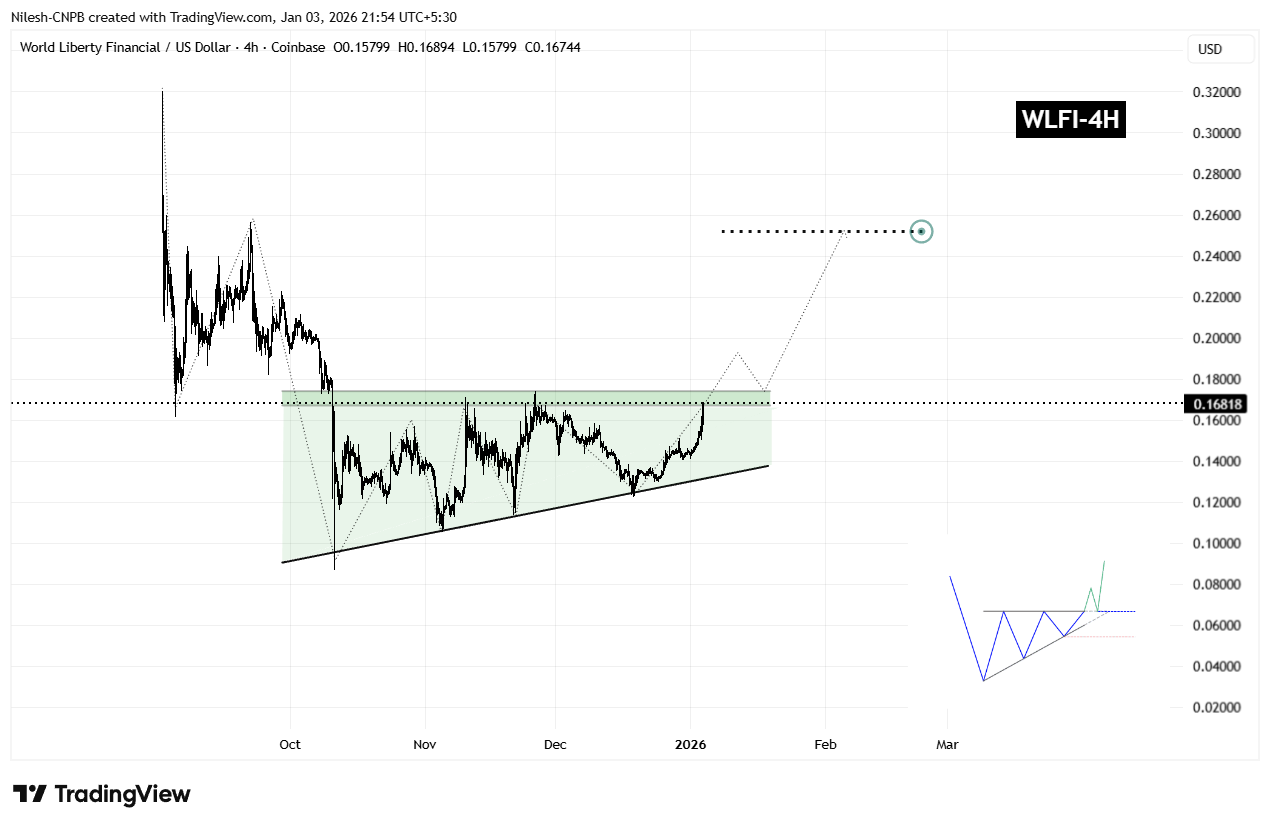
WLFI 4H Chart/Coinsprobe (Source: Tradingview)
The latest rebound has once again carried WLFI toward the upper boundary of the triangle, reinforcing the idea that demand remains firm. Rather than signaling weakness, this sideways-to-higher price action reflects healthy consolidation as volatility tightens ahead of a potential breakout.
What’s Next for WLFI?
From here, WLFI appears poised for another test of the $0.1741 resistance. A decisive breakout above this level, followed by a sustained close and a successful retest as support, would confirm the ascending triangle pattern and likely trigger a broader bullish expansion phase.
Based on the measured move of the formation, the technical upside projection points toward the $0.2522 region. This target represents a potential upside of roughly 48% from current levels and also aligns with prior price structure, strengthening the bullish case.
That said, caution remains warranted. If WLFI fails to break above resistance, price could once again rotate back toward the rising support trendline. As long as this trendline continues to hold, the broader bullish structure remains intact. A decisive breakdown below ascending support, however, would invalidate the pattern and delay any breakout scenario.
For now, the combination of improving market sentiment, steady accumulation, and a tightening ascending triangle suggests that WLFI is approaching a critical inflection point — one that could define its next major move as the new year unfolds.
Disclaimer: The views and analysis presented in this article are for informational purposes only and reflect the author’s perspective, not financial advice. Technical patterns and indicators discussed are subject to market volatility and may or may not yield the anticipated results. Investors are advised to exercise caution, conduct independent research, and make decisions aligned with their individual risk tolerance.
About Author: Nilesh Hembade is the Founder and Lead Author of Coinsprobe, with over 5 years of experience in the cryptocurrency and blockchain industry. Since launching Coinsprobe in 2023, he has been providing daily, research-driven insights through in-depth market analysis, on-chain data, and technical research.
Disclaimer: The information on this page may come from third parties and does not represent the views or opinions of Gate. The content displayed on this page is for reference only and does not constitute any financial, investment, or legal advice. Gate does not guarantee the accuracy or completeness of the information and shall not be liable for any losses arising from the use of this information. Virtual asset investments carry high risks and are subject to significant price volatility. You may lose all of your invested principal. Please fully understand the relevant risks and make prudent decisions based on your own financial situation and risk tolerance. For details, please refer to
Disclaimer.
Related Articles
Canton (CC) Price in a Downtrend – Analyst Says the Drop Isn’t Over
Sometimes the market tells you exactly what it’s going to do. You just have to be paying attention. For Canton, the story has been pretty clear for a while now. Down, and then more down.
Sjuul from AltCryptoGems caught this one early. He spotted that bearish rejection just in time, and since t
CaptainAltcoin1h ago
BTC rises 0.52% in 15 minutes: Major capital net inflows to exchanges and multiple market resonance driving the move
2026-03-20 21:15 to 21:30 (UTC), BTC recorded +0.52% return in 15 minutes, with a price range of 70124.0 to 70586.6 USDT, and amplitude of 0.66%. This round of volatility occurred against a backdrop of increased market attention and heightened fluctuations, with both on-chain and market participants showing highly active behavior.
The main driver of this volatility was whale funds (entities holding >=1,000 BTC) making a net inflow of 4,091.39 BTC to exchanges within 24 hours, data significantly exceeding the average for the same period. Concentrated net inflows
GateNews3h ago
Bitcoin Has Stabilized, But Investors Are Paying Up for Downside Protection: VanEck
Bitcoin's volatility has decreased to around $70,000, but traders are still heavily investing in downside protection. Although premiums for puts have dropped, they remain high historically, suggesting caution among investors. This defensiveness may signal an impending price bottom, as similar market conditions in the past have led to recoveries.
Decrypt3h ago
Cardano Flashes Weekly Buy Signal As ADA Holds Key $0.23 Support
Cardano is trying to shake off a bruising stretch of price weakness, and a fresh technical signal is giving traders a reason to pay attention again. Crypto analyst Ali Martinez said ADA has printed a TD Sequential buy signal on the weekly chart, showing a “black 9” that often appears when a
BlockChainReporter5h ago
