
**Date: **Wed, Jan 07, 2026 | 06:20 AM GMT
The broader cryptocurrency market continues to show strong New Year momentum, with Bitcoin (BTC) up around 4% and Ethereum (ETH) gaining over 9% on a weekly basis. This improving sentiment is gradually spilling over into major altcoins — including the DePIN-focused token Akash Network (AKT).
AKT has already posted an impressive 20% weekly gain. While this short-term strength has caught traders’ attention, the more important development is unfolding on the higher-timeframe chart. Recent price action suggests a meaningful shift in market structure, hinting that AKT may be transitioning out of a prolonged corrective phase and into the early stages of a bullish continuation.
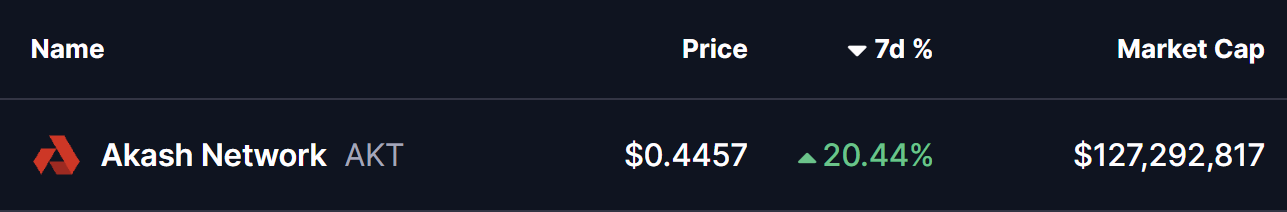
Source: Coinmarketcap
Falling Wedge and Rounding Bottom in Play
On the daily chart, AKT has been trading within a broader falling wedge — a structure that often precedes bullish reversals as selling pressure gradually weakens. Within this larger wedge, price action is also shaping a developing rounding bottom pattern, reflecting steady accumulation and seller exhaustion.
The formation began after AKT faced strong rejection near the $0.5441 resistance zone in late November. That rejection triggered a sharp sell-off, pushing price lower toward the $0.3465 region. However, bears failed to extend losses beyond this area. Instead, demand stepped in, downside momentum slowed, and price began to stabilize.
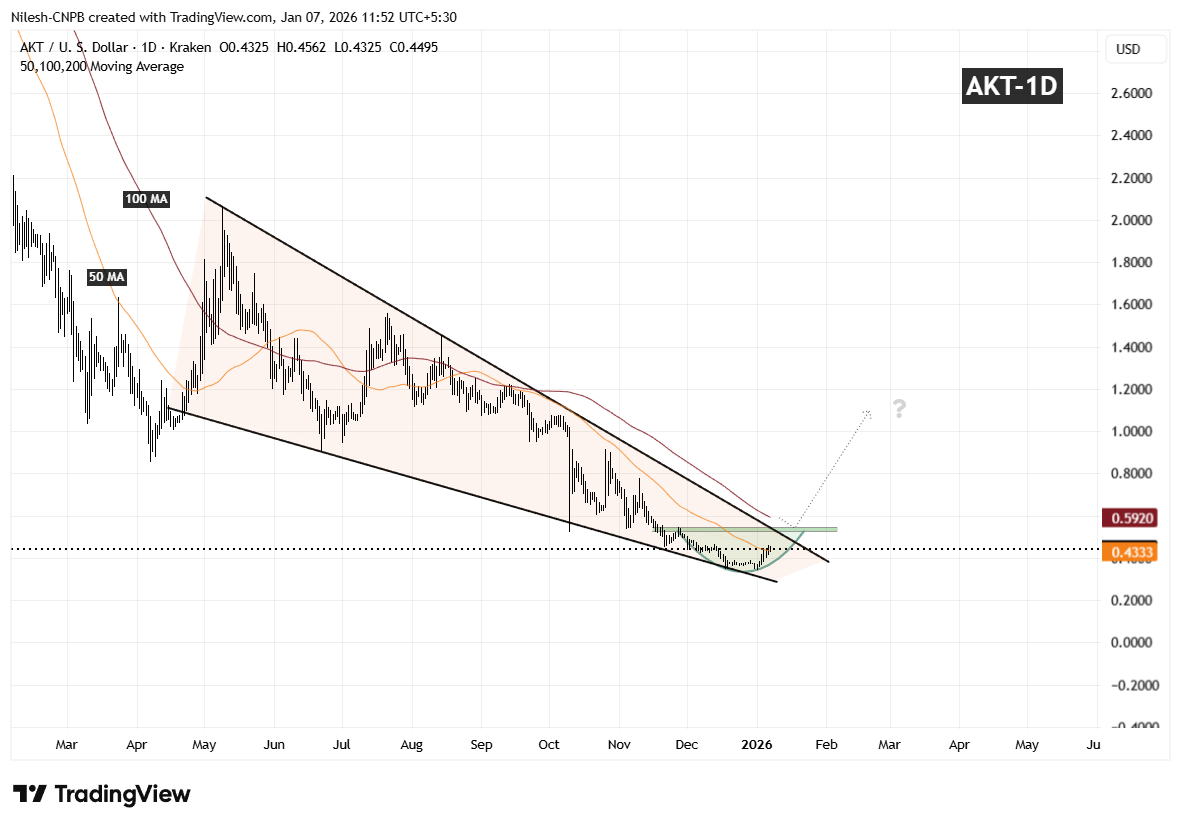
Akash Network (AKT) Daily Chart/Coinsprobe (Source: Tradingview)
Over the following weeks, volatility compressed and AKT started to curl higher in a smooth, rounded fashion — closely matching the textbook behavior of a rounding bottom. Importantly, the recent rebound has pushed price back above the 50-day moving average around $0.4333, a level that had previously acted as resistance and is now beginning to flip into support.
What’s Next for AKT?
If AKT can continue to hold above the 50-day moving average, this area may act as a solid base for further upside attempts. From here, attention shifts toward the descending resistance trendline of the falling wedge, which aligns closely with the $0.5441 resistance zone.
A clean and decisive breakout above this confluence area, followed by sustained acceptance, would confirm a broader bullish expansion phase and mark a clear trend reversal from the prior downtrend. Such a move would likely attract renewed momentum participation as the market recognizes the structural shift.
Until that breakout occurs, the pattern remains in development. Short-term consolidation or shallow pullbacks are still possible as price digests recent gains. However, as long as AKT continues to print higher lows above the established base, the broader technical structure remains constructive.
Overall, the chart suggests AKT is approaching a critical inflection point — one that could determine whether this recovery evolves into a sustained bullish trend as 2026 progresses.
Disclaimer: The views and analysis presented in this article are for informational purposes only and reflect the author’s perspective, not financial advice. Technical patterns and indicators discussed are subject to market volatility and may or may not yield the anticipated results. Investors are advised to exercise caution, conduct independent research, and make decisions aligned with their individual risk tolerance.
About Author: Nilesh Hembade is the Founder and Lead Author of Coinsprobe, with over 5 years of experience in the cryptocurrency and blockchain industry. Since launching Coinsprobe in 2023, he has been providing daily, research-driven insights through in-depth market analysis, on-chain data, and technical research.
Disclaimer: The information on this page may come from third parties and does not represent the views or opinions of Gate. The content displayed on this page is for reference only and does not constitute any financial, investment, or legal advice. Gate does not guarantee the accuracy or completeness of the information and shall not be liable for any losses arising from the use of this information. Virtual asset investments carry high risks and are subject to significant price volatility. You may lose all of your invested principal. Please fully understand the relevant risks and make prudent decisions based on your own financial situation and risk tolerance. For details, please refer to
Disclaimer.
Related Articles
比特幣力守 7 萬美元!鏈上驚見「集體拋售潮」,散戶成最大賣壓來源
在中東地緣政治緊張的背景下,比特幣遭遇全面拋售,幾乎所有持幣者都轉向淨賣出,以散戶最為明顯。根據Glassnode數據,累積趨勢分數降至0.04,顯示市場賣壓沉重。小額持幣者及中型投資人拋售強度明顯,巨鯨大戶雖然減持,但力度較小。儘管數據慘淡,比特幣仍展現抗跌能力。
区块客18m ago
Shiba Inu Surges 5% as Short Squeeze Drives SHIB Momentum
SHIB rebounded 5% to $0.00000572, reversing a week of losses.
Short sellers faced $38,680 in liquidations, fueling a strong momentum shift.
Technical indicators suggest rising pressure, with resistance at $0.00000587 and support at $0.00000526.
Shiba Inu staged a sharp rebound on
CryptoNewsLand1h ago
Whales holding between 10 and 10,000 BTC increased their holdings, accounting for 68.17% of the total supply.
Santiment report shows that investors holding 10 to 10,000 bitcoins have increased, now controlling 68.17% of the supply. Bitcoin is performing strongly relative to the S&P 500, showing signs of a positive reversal. The S&P 500 has declined 2.2%, while Bitcoin has risen 2.4%.
GateNews2h ago
SHIB Derivatives See 1,549% Jump in Netflows: Is Short Squeeze Brewing? - U.Today
Shiba Inu (SHIB) experienced a 1,549% increase in futures netflows as traders adjusted their positions, with inflows surpassing outflows. Despite a recent price drop, positive on-chain indicators suggest potential for a market rebound if buyers return.
UToday3h ago
On-chain activity is exploding, but Ethereum can't seem to gain momentum? Experts reveal the "fatal weakness": could drop to $1,500
CryptoQuant reports indicate that Ethereum faces an "adoption paradox," where despite network activity reaching new highs, the token price has declined. If the bear market continues, Ether could potentially fall to $1,500 by the end of the third quarter. Smart contract activity has risen while decoupling from Ether's price, with exchange inflows being a better reflection of price dynamics. Weak investment demand and continuous capital outflows remain the primary concern.
区块客3h ago
英國前首相喊:比特幣是龐氏騙局,川普次子 Eric Trump、Michael Saylor 強力反駁
前英國首相波里斯·強森在《每日郵報》指控比特幣為「龐氏騙局」,引發加密界人士如Eric Trump和Michael Saylor的反擊,強調比特幣的去中心化特性及其正當性。比特幣近期交易價格也突破7.1萬美元。
動區BlockTempo3h ago