
**Date: **Sun, Jan 04, 2026 | 01:14 PM GMT
As 2026 gets underway, the broader cryptocurrency market is showing renewed stability. Ethereum (ETH) is up nearly 6% on the week, and several major altcoins are beginning to regain momentum. Against this improving backdrop, Hyperliquid (HYPE) is quietly positioning itself as a potential late mover, with its chart structure starting to flash early bullish signals.
While HYPE remains mostly flat on the weekly timeframe, the more important story is unfolding beneath the surface. Recent price action suggests a meaningful structural shift may be underway — one that could mark the early stages of a bullish continuation if key levels are reclaimed.
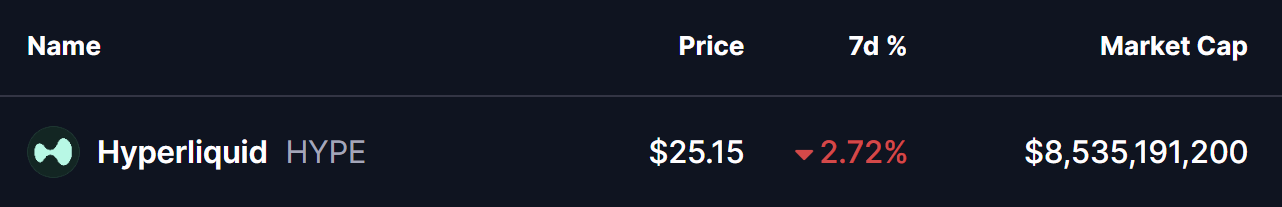
Source: Coinmarketcap
Rounding Bottom Pattern Taking Shape
On the daily timeframe, Hyperliquid appears to be forming a rounding bottom pattern, a classic bullish reversal structure that typically develops after a prolonged corrective phase. This pattern reflects a slow transition from aggressive selling to steady accumulation, as downside momentum fades and buyers gradually step back in.
The setup began after HYPE faced strong rejection near the $51.42–$50.06 neckline resistance zone, which triggered a sharp decline through late November and December. That downside move eventually found strong demand near the $22.20 support level, where selling pressure stalled. Multiple defenses of this area prevented further downside and helped establish a solid base for a potential trend reversal.
Since carving out that bottom, HYPE has started to curve higher in a smooth, rounded fashion — closely matching the textbook structure of a developing rounding bottom. The recent stabilization above the $25 region further supports the view that selling pressure is weakening and accumulation may be underway.
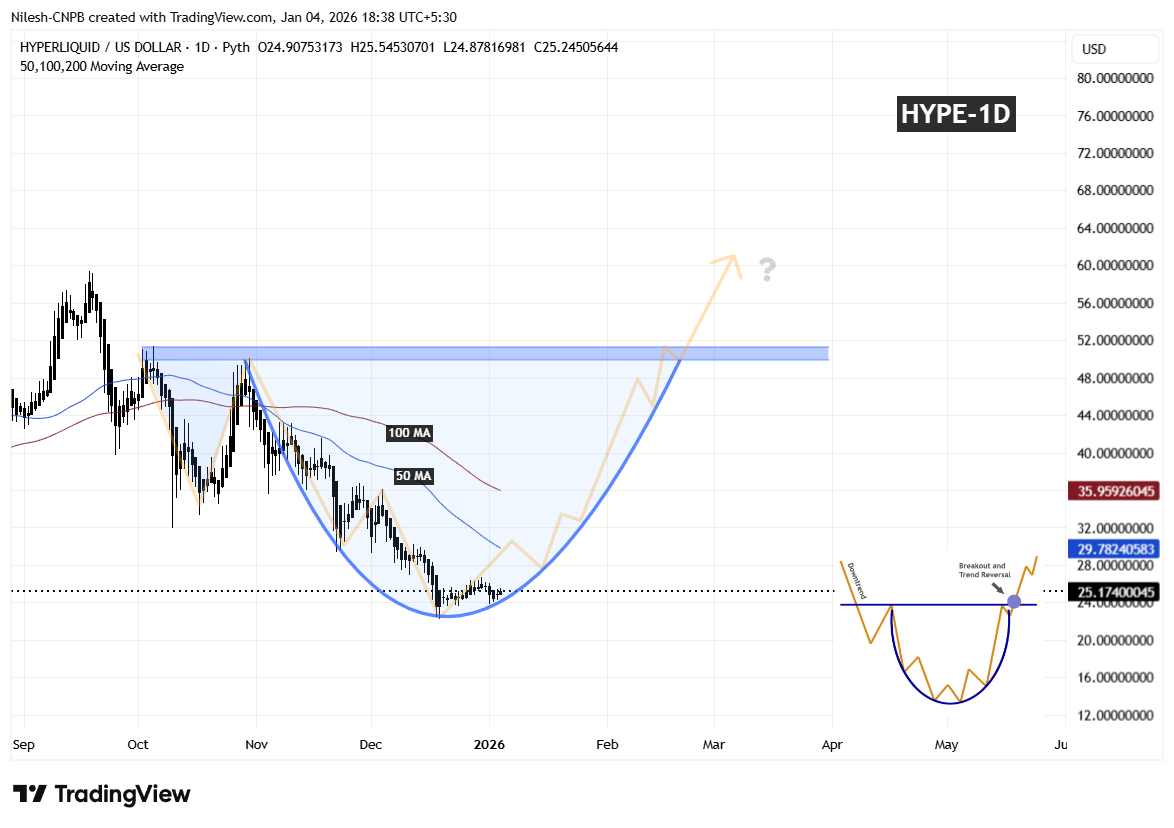
Hyperliquid (HYPE) Daily Chart/Coinsprobe (Source: Tradingview)
A key technical level now comes into play: the 50-day moving average, currently hovering near $29.78. This level has acted as dynamic resistance during the early recovery phase, and reclaiming it would mark an important shift in short-term market structure.
What’s Next for HYPE?
A sustained reclaim of the 50-day MA would be the first meaningful confirmation that buyers are regaining control after months of corrective price action. Holding above this level could allow price to build momentum toward the 100-day MA, which would further reinforce the developing reversal structure.
Looking ahead, the most important level remains the $51.42–$50.06 neckline resistance zone. A clean breakout above this area would validate the entire rounding bottom pattern and could open the door to a broader bullish expansion phase, with momentum traders likely re-entering the market.
In the near term, all eyes remain on the 50-day MA reclaim for upside confirmation. Until that happens, short-term consolidation or shallow pullbacks remain possible. However, as long as price continues to hold above the established base, the broader bottoming structure remains intact and constructive.
Disclaimer: The views and analysis presented in this article are for informational purposes only and reflect the author’s perspective, not financial advice. Technical patterns and indicators discussed are subject to market volatility and may or may not yield the anticipated results. Investors are advised to exercise caution, conduct independent research, and make decisions aligned with their individual risk tolerance.
About Author: Nilesh Hembade is the Founder and Lead Author of Coinsprobe, with over 5 years of experience in the cryptocurrency and blockchain industry. Since launching Coinsprobe in 2023, he has been providing daily, research-driven insights through in-depth market analysis, on-chain data, and technical research.
Disclaimer: The information on this page may come from third parties and does not represent the views or opinions of Gate. The content displayed on this page is for reference only and does not constitute any financial, investment, or legal advice. Gate does not guarantee the accuracy or completeness of the information and shall not be liable for any losses arising from the use of this information. Virtual asset investments carry high risks and are subject to significant price volatility. You may lose all of your invested principal. Please fully understand the relevant risks and make prudent decisions based on your own financial situation and risk tolerance. For details, please refer to
Disclaimer.
Related Articles
CryptoQuant: Ethereum Faces "Adoption Paradox," ETH Could Drop to $1,500
Ethereum is facing an "adoption paradox," with network activity reaching all-time highs while ETH price has declined significantly. CryptoQuant analysis indicates that if the bear market persists, ETH could fall to $1,500. The relationship between exchange inflows and price dynamics is more pronounced, suggesting ETH is facing strong selling pressure.
GateNews15m ago
Today's cryptocurrency Fear and Greed Index dropped to 15, with the market still in extreme panic mode
Gate News: On March 13, according to Alternative.me data, the Cryptocurrency Fear and Greed Index fell to 15 today, down further from yesterday's 18, with the market still in an "extreme fear state."
GateNews19m ago
ETH 15-minute increase of 0.79%: Liquidity phase decline and short-term fund arbitrage resonance driving upward momentum
March 13, 2026, 00:00 to 00:15 (UTC), Ethereum (ETH) experienced a significant upward price movement in a short timeframe, with the 15-minute interval return reaching +0.79%. The price range was 2070.45 to 2090.33 USDT, with a volatility amplitude of 0.96%. Market fluctuations intensified during this period, capturing traders' attention.
The primary driver of this price movement was a phase-wise decline in market liquidity. During this period, there were no on-chain large transfers, DeFi liquidations, or significant derivatives liquidations recorded. Major macro and industry news updates also showed no sudden events. During the Europe-US trading session
GateNews19m ago
BTC 15-minute surge of 0.84%: On-chain fund flow and technical breakout synergy drive volatility
March 13, 2026, 00:00 to 00:15 (UTC), BTC price fluctuated within the range of 70394.0 to 71116.3 USDT in just 15 minutes, with a return rate of +0.84% and volatility amplitude reaching 1.02%. During this period, mainstream market attention increased, driving active trading and notably elevated price volatility, reflecting a marked warming of market sentiment during this timeframe.
The primary driver of this price movement was large on-chain fund transfers and concentrated whale account buying activity. Historical on-chain data observations show that single transfers exceeding 1000 BTC have frequently served as catalysts for upward price movements.
GateNews19m ago
Oil prices soar past $100, U.S. stocks hit new lows for the year, Bitcoin holds steady at 70k
Due to the ongoing Iran conflict, oil prices have surged significantly, with Brent crude breaking $100 per barrel for the first time. U.S. stock indices' three major indexes hit new lows since 2026. The crypto market remained relatively stable, with Bitcoin holding around $70,000. Goldman Sachs warned that if oil supply remains weak, prices could spike to 2008 highs.
ChainNewsAbmedia51m ago
Chainlink (LINK) Price Prediction: What Comes Next After the Wave 5 Decline
Chainlink seems to have found a familiar groove. It has been moving sideways after the fall from the February highs of $12.50. Both bulls and bears are waiting for a clear trend in the cryptocurrency. The daily chop hides a more structured picture beneath the surface, one that technical
CaptainAltcoin1h ago