
When you zoom out and look at what Monero has been doing lately, the picture becomes pretty clear.
The XMR price has been trending higher overall, but instead of ripping upward, it’s been compressing into a tighter range. That compression has formed a clean ascending triangle, which usually shows buyers stepping in more confidently while sellers keep defending the same level.
Trader Ardi points out that Monero is now printing a higher low while continuing to push into the $460 area. That level has rejected the price several times already, so it’s not surprising the market is slowing down here.
What matters is that each pullback is getting smaller. Buyers are clearly showing up earlier than before, and that usually means pressure is building.
- Why the $460 Level Is So Important for XMR
- What the XMR Chart Is Telling Us Right Now
- What Comes Next for XMR?
Why the $460 Level Is So Important for XMR
The $460 zone isn’t just another number on the chart. It lines up with previous highs and has acted as a wall every time price has tested it. Right now, the XMR price is pressing right up against that resistance while still respecting the rising trendline underneath.
That combination is key. As long as the price keeps holding those higher lows, the setup stays intact. What traders want to see next is acceptance above $460, not just a quick wick or short-lived push.
A real breakout means holding above that level and flipping it into support. Until that happens, Monero remains in a coiling phase rather than a confirmed breakout.
What the XMR Chart Is Telling Us Right Now
From a structure point of view, this is exactly how strong setups tend to behave before a bigger move.
Instead of selling off hard after rejection, the XMR price keeps coming back to resistance with less downside each time. That usually means sellers are slowly getting absorbed.
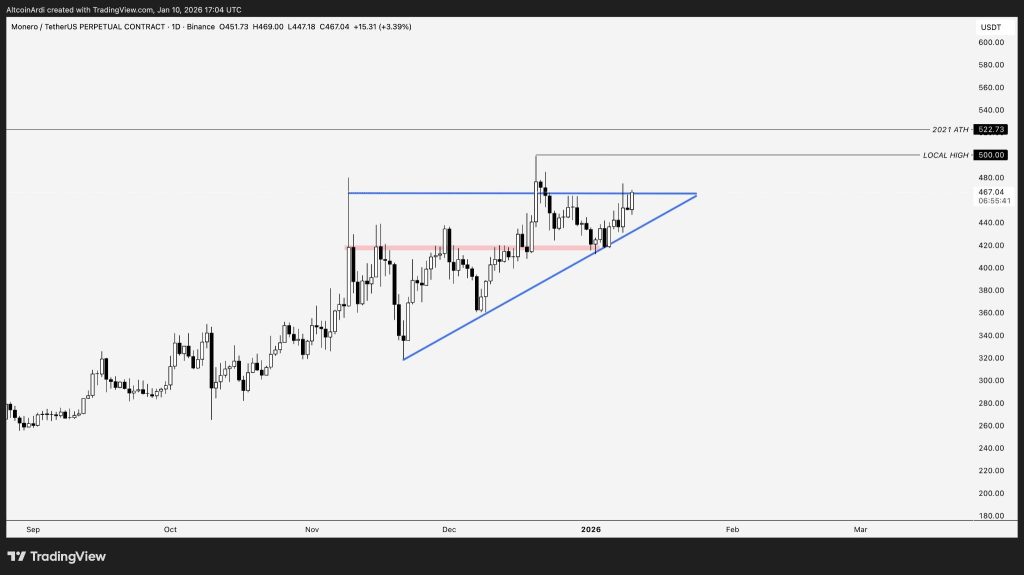
Source: X/@ArdiNSC
The higher low on the chart supports that idea. It shows buyers are defending price more aggressively, even though resistance is still holding.
This kind of price action can feel slow and frustrating, which Ardi also mentions, but it often does a good job of shaking out impatient traders before the move actually happens.
Bittensor (TAO) Price Tests a Key Level That Could Change the Trend_**
What Comes Next for XMR?
However, if the XMR price can manage to break past the level of $460 and sustain it, the ascending pattern would be resolved. The next level in such a case would be the area of $500, with a further move towards the 2021 high of $522.
If the price fails to hold the rising trendline, the breakout idea gets delayed. A dip toward the low $420s or high $400s wouldn’t break the structure on its own, but it would stretch out the consolidation and test buyer confidence again.
For now, the setup is still very much alive. The XMR price isn’t breaking down, downside is being defended, and pressure continues to build. This is one of those charts where patience usually matters more than speed, and that’s often when Monero tends to surprise people.
Disclaimer: The information on this page may come from third parties and does not represent the views or opinions of Gate. The content displayed on this page is for reference only and does not constitute any financial, investment, or legal advice. Gate does not guarantee the accuracy or completeness of the information and shall not be liable for any losses arising from the use of this information. Virtual asset investments carry high risks and are subject to significant price volatility. You may lose all of your invested principal. Please fully understand the relevant risks and make prudent decisions based on your own financial situation and risk tolerance. For details, please refer to
Disclaimer.
Related Articles
The US-Iran conflict enters the second phase: Trump emphasizes "no ground action for now," airstrikes have destroyed over 3,000 targets, Bitcoin drops to 67,000.
Trump stated that the U.S. military currently has no plans to deploy ground troops, mainly conducting airstrikes, and has destroyed over 3,000 Iranian military targets. Market risk aversion has increased, with Bitcoin dropping to $67,000. The fighting continues between both sides, and Iran has vowed to retaliate.
動區BlockTempo30m ago
PEPE faces volatility risk as the threat of a "short squeeze" increases
The memecoin market is experiencing a significant downturn as the total industry capitalization has dropped by 48% over the past year and declined another 6.9% in the most recent month, according to data from CoinMarketCap. Meanwhile, a report from Glassnode indicates that this sector has only grown modestly by 2.2% in the past t
TapChiBitcoin32m ago
Willy Woo: BTC's early decline was too rapid, and it is now creating conditions for a rebound to $85,000.
On March 8th, analyst Willy Woo pointed out that Bitcoin faced resistance near $75,000, but since mid-February, capital flows have been recovering, and market sentiment may shift toward risk appetite. Although there is a short-term rebound opportunity, in the long term, Bitcoin remains in the mid-stage of a bear market and may experience sideways consolidation and test resistance levels.
GateNews1h ago
Today, the cryptocurrency Fear and Greed Index is at 12, indicating the market is in extreme fear.
Gate News Report, March 8th, according to Alternative.me data, today’s cryptocurrency Fear and Greed Index is at 12, indicating the market is in a "Extreme Fear" state. This index measures market sentiment, with lower values indicating higher levels of fear.
GateNews1h ago
CryptoQuant Analyst: Bitcoin NUPL-MVRV indicator reaches 0.33, indicating that extreme selling conditions are moderating
Gate News Announcement, March 8 — CryptoQuant analyst Axel posted on X platform that Bitcoin may have entered the mid-stage of this bear market cycle. Data shows that the NUPL–MVRV harmonic composite indicator has reached 0.33, while historical cycle bottoms typically occur around the -0.5 level. The chart indicates that the start of the bear market cycle is trending upward, suggesting that extreme selling conditions are moderating. However, the indicator remains well above historical bottom levels, indicating that a full-scale market sell-off has not yet been confirmed.
GateNews2h ago