
**Date: **Mon, Jan 05, 2026 | 10:58 AM GMT
As 2026 kicks off, the broader cryptocurrency market is showing renewed stability. Both Bitcoin (BTC) and Ethereum (ETH) are up more than 6% on the week, and improving sentiment is gradually spreading across major altcoins — including the DeFi heavyweight Aave (AAVE).
AAVE has gained over 8% on a weekly basis, but the more important story is unfolding beneath the surface. While short-term strength is encouraging, the bigger development lies in the broader market structure forming on the higher timeframe. Recent price action suggests a meaningful shift in behavior — one that could mark the early stages of a bullish continuation if key technical levels hold.
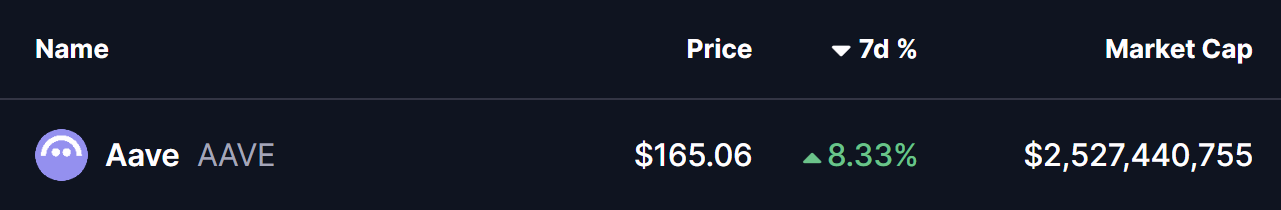
Source: Coinmarketcap
Symmetrical Triangle in Play
On the weekly chart, **AAVE **continues to trade within a symmetrical triangle, a neutral yet powerful pattern that often precedes a major volatility expansion once price approaches its apex.
The structure began forming after AAVE’s strong rally earlier in 2025. However, in August 2025, price faced firm rejection near the triangle’s descending resistance around $385, triggering a sharp corrective move. That pullback resulted in a 62% decline, eventually driving price down toward the triangle’s ascending support trendline near $143.53 last month.
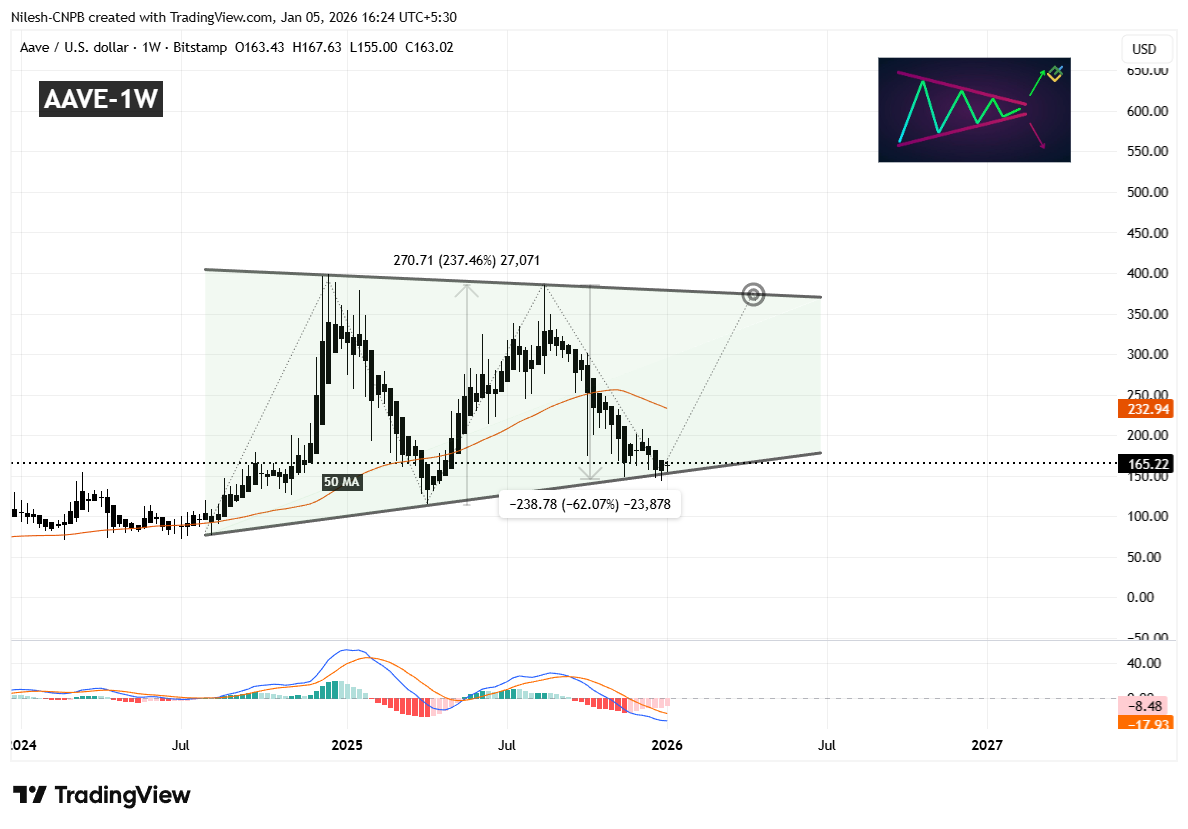
Aave (AAVE) Weekly Chart/Coinsprobe (Source: Tradingview)
Crucially, buyers once again stepped in to defend this long-term support zone. The successful reaction from this level has pushed AAVE back toward the $164 region, signaling renewed buying interest. Notably, this rebound is occurring as the MACD shows early signs of stabilization — a setup that closely resembles conditions seen before AAVE’s previous 237% rally in April 2025.
The next major technical hurdle lies at the 50-week moving average, currently positioned near $232.94. This level has acted as dynamic resistance during the recent decline, and reclaiming it would mark a meaningful shift in medium-term momentum.
What’s Next for AAVE?
If the pattern continues to develop as expected, AAVE could soon attempt a sustained move above the 50-week MA. A confirmed reclaim of this level — followed by acceptance above it — would strengthen the bullish case and increase the probability of a move toward the upper boundary of the triangle near $375.
Such a move would imply a potential upside of roughly 125% from current levels, assuming broader market conditions remain supportive and momentum continues to build.
Until then, patience remains key. Holding above the ascending support trendline is essential for preserving the bullish structure. Any sustained breakdown below this level would weaken the setup and delay the breakout thesis.
For now, the chart suggests AAVE is at a critical inflection point, where compression within the triangle could soon give way to a decisive move — with the direction likely defined by how price behaves around the 50-week moving average.
Disclaimer: The views and analysis presented in this article are for informational purposes only and reflect the author’s perspective, not financial advice. Technical patterns and indicators discussed are subject to market volatility and may or may not yield the anticipated results. Investors are advised to exercise caution, conduct independent research, and make decisions aligned with their individual risk tolerance.
About Author: Nilesh Hembade is the Founder and Lead Author of Coinsprobe, with over 5 years of experience in the cryptocurrency and blockchain industry. Since launching Coinsprobe in 2023, he has been providing daily, research-driven insights through in-depth market analysis, on-chain data, and technical research.
Disclaimer: The information on this page may come from third parties and does not represent the views or opinions of Gate. The content displayed on this page is for reference only and does not constitute any financial, investment, or legal advice. Gate does not guarantee the accuracy or completeness of the information and shall not be liable for any losses arising from the use of this information. Virtual asset investments carry high risks and are subject to significant price volatility. You may lose all of your invested principal. Please fully understand the relevant risks and make prudent decisions based on your own financial situation and risk tolerance. For details, please refer to
Disclaimer.
Related Articles
Bitcoin Holds Strong at $70,000! On-Chain Data Reveals "Collective Selling Wave," Retail Investors Emerge as Biggest Selling Pressure
Against the backdrop of Middle East geopolitical tensions, Bitcoin has faced a comprehensive sell-off with nearly all coin holders turning to net selling, most notably among retail investors. According to Glassnode data, the cumulative trend score has dropped to 0.04, indicating heavy selling pressure in the market. Small-cap holders and mid-sized investors are showing significant selling intensity, while whales, though reducing their holdings, are doing so at a lower rate. Despite the dismal data, Bitcoin continues to demonstrate resilience against declines.
区块客6m ago
CryptoQuant: Bitcoin and Gold Correlation Falls to Nearly 4-Year Low, Showing Clear Divergence in Trends
The correlation between Bitcoin and gold has fallen to its lowest level since November 2022, showing a clear divergence in their trajectories. Despite Bitcoin's recent rebound to $70,000, bearish pressure is intensifying, and investors need to monitor key support levels and gold price movements to gauge market direction.
GateNews19m ago
XRP breaks through $1.5 neckline, key EMA resistance determines short-term trend, potential to test $2
XRP recently broke through the $1.5 resistance level, creating a new closing high. Analysts point out that the short-term support level is at $1.5, which needs to hold to continue the uptrend. If this level breaks, the $1.42 support can be referenced as an alternative. A breakout above three EMAs is needed to confirm a bullish reversal. Market participants should pay attention to price movement and changes in technical indicators.
GateNews33m ago
Hyperliquid Price Jumps 22% as Commodity Trading Hits Record
Key Insights:
Hyperliquid surged over 20% weekly, driven by record commodity futures trading volumes, especially oil and silver contracts, gaining strong traction among traders.
Whale activity surpassed $3.6 billion in leveraged positions, boosting liquidity and reinforcing upward momentum a
CryptoFrontNews36m ago
Bitcoin Falls Below $70,000: PPI Exceeds Expectations + Powell's Hawkish Stance, Rate Cut Expectations Dampened
On March 19, Bitcoin pulled back to a key support zone due to unexpected U.S. inflation data and hawkish signals from Federal Reserve Chair Powell, declining over 4.6% and currently trading near $70,800. Market expectations for rate cuts have cooled, with the total crypto market cap declining to approximately $2.51 trillion and sentiment remaining cautious. If Bitcoin breaks below $70,000, it could potentially decline further to $65,000. Market momentum is highly dependent on macroeconomic factors.
GateNews42m ago
Bitcoin Fails to Break Higher: Why the $70,000 Level Remains Elusive? Key Indicators Reveal Upside Concerns
Bitcoin recently briefly broke through $74,000 but pulled back to around $70,800 due to selling pressure from short-term holders. While the price shows an upward trend, it faces structural resistance, and the current movement appears more like a bear market rally rather than the start of a bull market. Without effectively resisting selling pressure, it could break below the $70,000 support level. The market is still waiting for clearer signals.
GateNews50m ago
