Tuesday, the DUSK (DUSK) price continued to stay above $0.20, after recording an impressive increase of over 31% on Monday. This privacy-focused cryptocurrency surged more than 1.75 times just last week, as open interest (OI) and trading volume hit a historic high. This momentum was further reinforced when DUSK announced a partnership with Chainlink (LINK) on Monday, opening cross-chain interaction possibilities for tokenized real-world assets, while also confirming the increasing long-term application potential of this coin.
Derivatives and on-chain data for DUSK show an upward trend
According to CoinGlass data, the open interest (OI) in futures contracts reached a record high of $47.94 million on Monday, before stabilizing around $41.38 million on Tuesday. Specifically, on Binance, OI hit $20.54 million — the highest since February 2023. This sharp increase in OI reflects new capital flowing into the market, along with increased buying pressure, fueling DUSK’s current upward momentum.
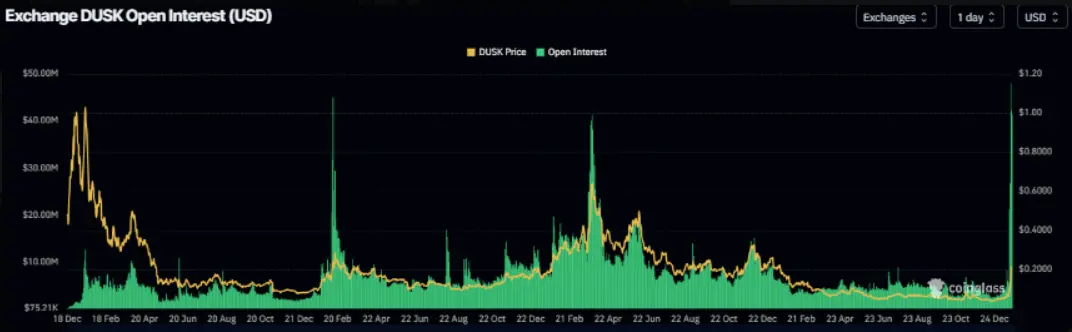 Open contract volume of DUSK across all exchanges | Source: Coinglass
 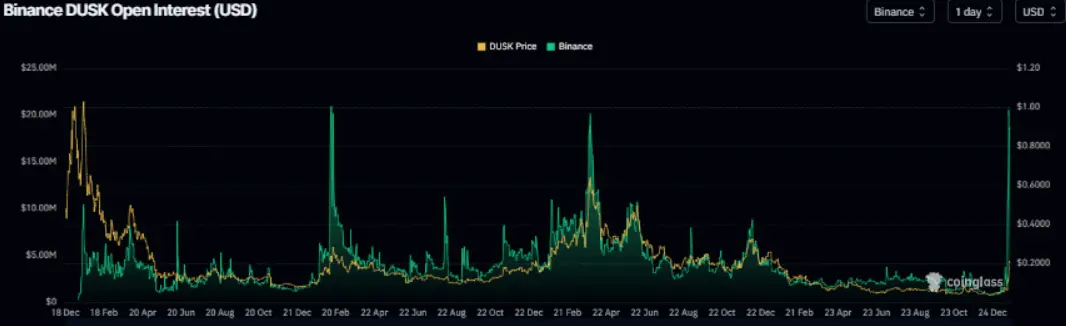 Open interest volume chart (OI) of DUSK futures on Binance | Source: Coinglass
Not only OI, but data from Santiment also shows that trading volume across the entire DUSK ecosystem — aggregated from all on-chain applications — reached a record $298.43 million on Monday and remained around $264.16 million on Tuesday. This trading volume explosion demonstrates high interest and liquidity from traders, reinforcing strong bullish prospects for DUSK.
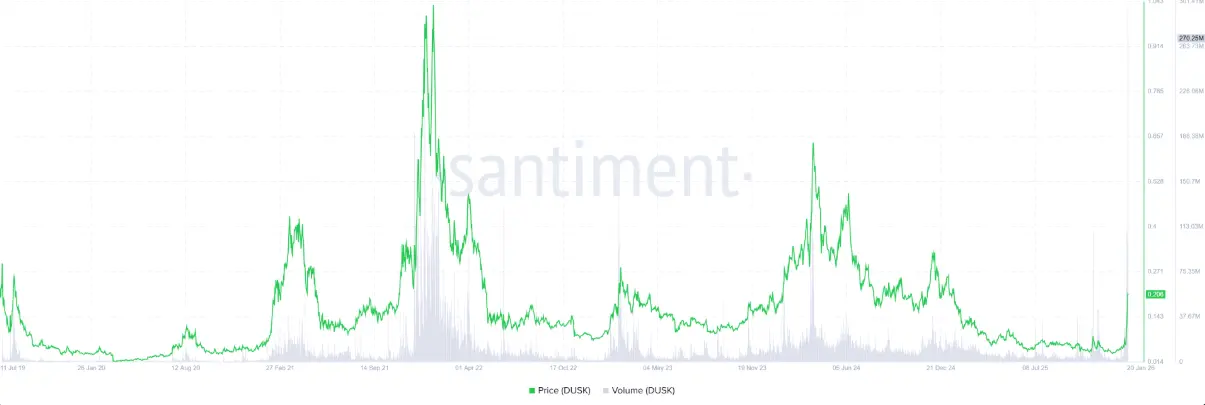 DUSK trading volume chart | Source: Santiment## DUSK partners with Chainlink to bring managed assets onto the chain
On Monday, DUSK announced a strategic partnership with Chainlink to integrate key standards into DuskEVM. This collaboration opens up cross-chain interaction for tokenized real-world assets and provides real-time data with high reliability, supporting compliant financial applications, guaranteed by NPEX — a fully regulated Dutch stock exchange.
These advancements not only demonstrate DUSK’s growing commitment to asset tokenization, but also strengthen its infrastructure, enhance long-term utility, and send positive signals for the value of the DUSK token.
DUSK price forecast: Bulls aim for $0.33
On the weekly timeframe, DUSK made an impressive breakout, nearly tripling in price since late December, followed by four consecutive weeks of green candles. This week, the upward momentum continues as DUSK surged nearly 30%, breaking through a key resistance at $0.17.
If this bullish trend persists and DUSK maintains above $0.17, the price is likely to extend its rally toward the December high at $0.33. The buying momentum is very strong, with the weekly RSI reaching 79, indicating overbought conditions, while the MACD also signals positive momentum with blue histogram bars emphasizing the strength of the uptrend.
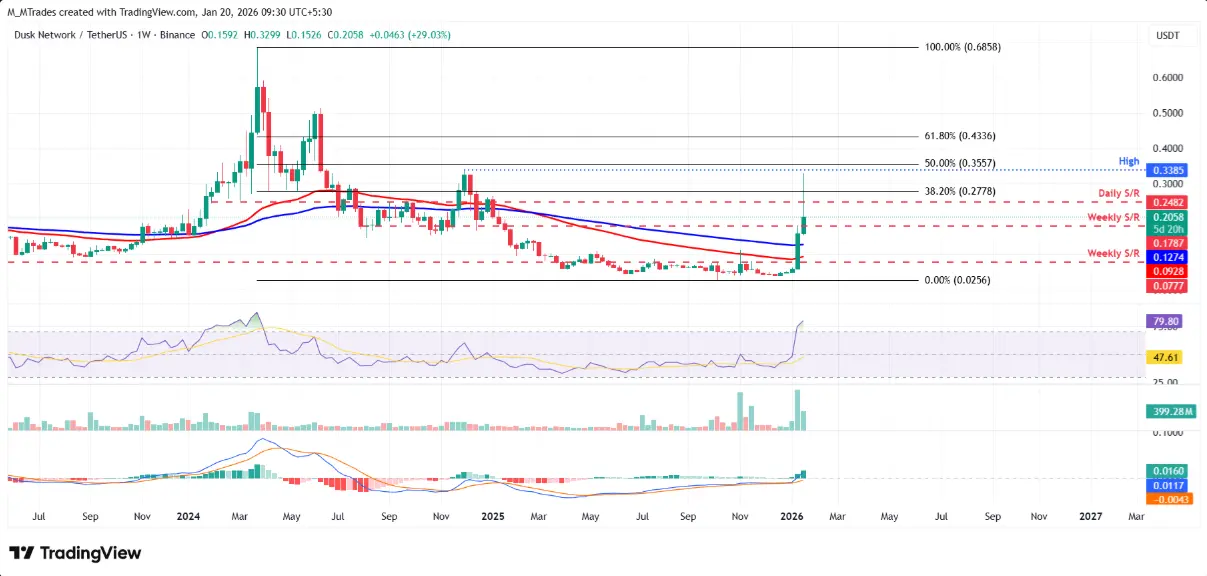 Weekly DUSK/USDT chart | Source: TradingView On the daily timeframe, DUSK broke a 10-month sideways channel last Saturday, then increased over 79% in just two days, trading around $0.21 by Tuesday. If the rally continues, the price could challenge the Monday high at $0.33.
However, the daily RSI has spiked to 91, signaling extreme overbought conditions, which implies short-term correction or consolidation risks. The MACD remains bullish, supporting a positive outlook, but if DUSK faces selling pressure, the price could retreat to the 50% support zone around $0.18.
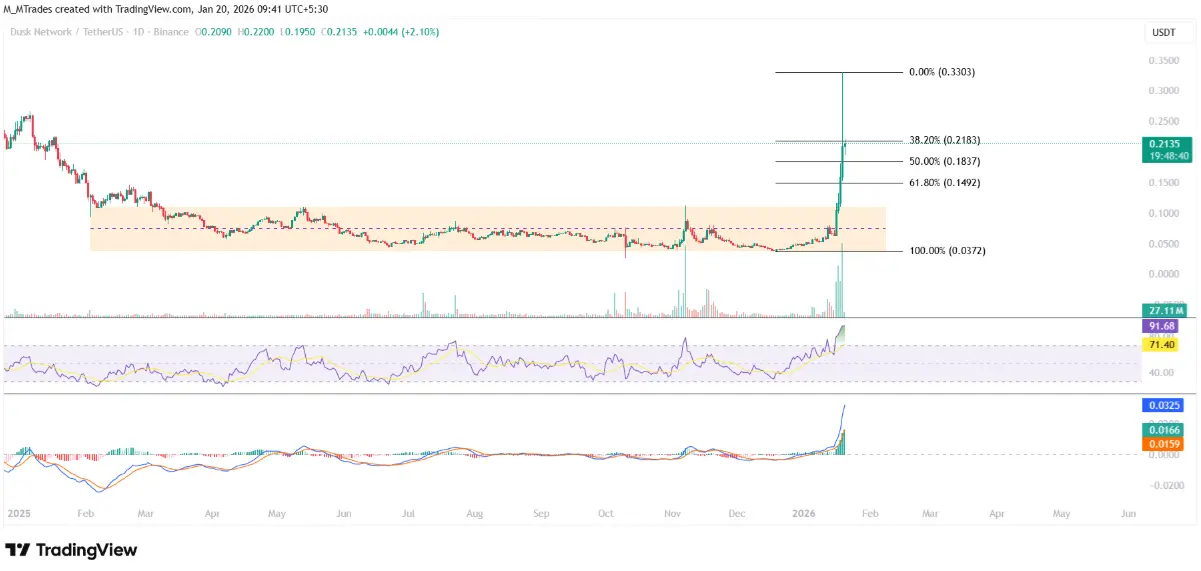 Daily DUSK/USDT chart | Source: TradingView
Disclaimer: The information on this page may come from third parties and does not represent the views or opinions of Gate. The content displayed on this page is for reference only and does not constitute any financial, investment, or legal advice. Gate does not guarantee the accuracy or completeness of the information and shall not be liable for any losses arising from the use of this information. Virtual asset investments carry high risks and are subject to significant price volatility. You may lose all of your invested principal. Please fully understand the relevant risks and make prudent decisions based on your own financial situation and risk tolerance. For details, please refer to
Disclaimer.
Related Articles
XRP Price Structure Tightens While Heatmap Highlights $1.30 Liquidity Zone
XRP trades near $1.37 support after a 0.9% daily decline, while the $1.44 level remains the immediate resistance in the current range.
A three-week liquidity heatmap highlights a large order cluster around $1.30, indicating a strong liquidity zone below price.
A three-month Gaussian
CryptoNewsLand17m ago
Billionaire Investor Stanley Druckenmiller Bullish on Stablecoin Growth
Billionaire investor Stanley Druckenmiller believes stablecoins will become the backbone of the financial system in 10-15 years, citing their efficiency. However, he views much of the wider crypto market as unnecessary, describing it as “a solution looking for a problem.”
Decrypt38m ago
SOL Consolidates Near $84 While Chart Highlights Possible $45 Demand Zone
Solana (SOL) trades at $83.87 within a range defined by $81.03 support and $84.43 resistance, showing consolidation below a $90 supply zone. There is a broader demand area near $45, indicating potential downward movement before recovery.
CryptoNewsLand1h ago
BTC 15分钟下挫0.63%:宏观数据打压风险偏好叠加ETF资金流出加剧抛压
2026-03-13 17:15 至 2026-03-13 17:30(UTC)期间,比特币(BTC)15分钟K线波动加剧,收益率录得-0.63%,报价在71600.0至72243.9 USDT之间,振幅达到0.89%。异动引发市场关注,订单薄压力显现,短线资金两极分化明显。
本次异动的主要驱动力来自宏观经济数据公布后市场风险偏好骤降以及ETF资金净流出。美国最新GDP数据下修至0.7%,远低于
GateNews1h ago
BTC 15分钟上涨0.62%:地缘冲突推升避险需求与链上资金共振驱动上行
2026-03-13 16:30 至 2026-03-13 16:45(UTC),BTC价格在71379.5 USDT至71870.0 USDT区间波动,15分钟内收益率录得+0.62%,振幅达到0.69%,带动市场关注度显著升温。短线资金活跃,波动节奏加快,显示市场避险情绪占据主导。
本次异动的主要驱动力是全球宏观地缘冲突升级引发油价飙升,触发传统风险资产普遍承压。美股等主流市场出现资金流出
GateNews2h ago
PEPE Consolidates Above $0.05324 Support as Momentum Strengthens and Resistance Near $0.05336 Holds
PEPE has a tight intraday price compression with a support level of $0.053243 and resistance level of $0.053363.
A RSI of 64.13 represents the moderate bullish momentum whereas MACD history is slightly positive, which indicates the gradual buying momentum.
The price is at $0.053364
CryptoNewsLand2h ago