
Key Takeaways
-
Pump.fun (PUMP) is showing early signs of a bullish reversal despite recent market volatility.
-
Strong on-chain performance supports the technical setup, with Pump.fun ranking among the top revenue-generating crypto protocols over the past 30 days.
-
A rounding bottom pattern is forming on the daily chart, indicating gradual accumulation after a prolonged downtrend.
The crypto market has turned green again, largely driven by easing geopolitical tensions after U.S. President Donald Trump stepped back from Greenland-related tariff threats following a productive meeting. This de-escalation sparked a risk-on mood across global markets, helping Bitcoin regain strength and lifting sentiment across altcoins.
Amid this recovery, Pump.fun (PUMP) has quietly begun to stand out. While the token is up nearly 5% on the day, the more compelling story lies beneath the surface — where strong fundamentals and a improving technical structure are starting to align, hinting that a larger move could be forming.
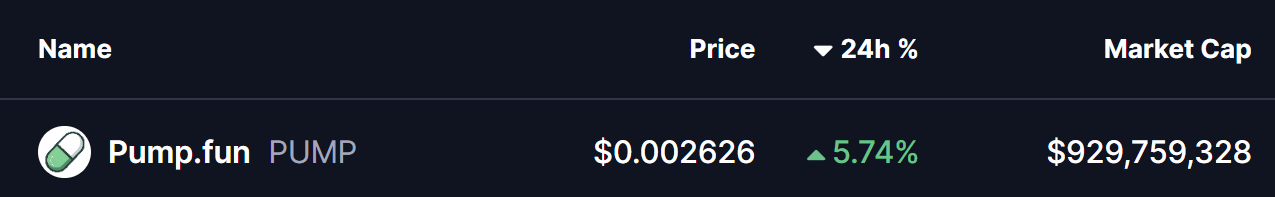
Source: Coinmarketcap
Strong On-Chain Metrics Support the Case
Beyond short-term price fluctuations, Pump.fun’s on-chain performance remains a major positive. According to DefiLlama, Pump.fun ranked as the fourth-highest revenue-generating crypto protocol over the past 30 days, pulling in approximately $38.28 million in fees.
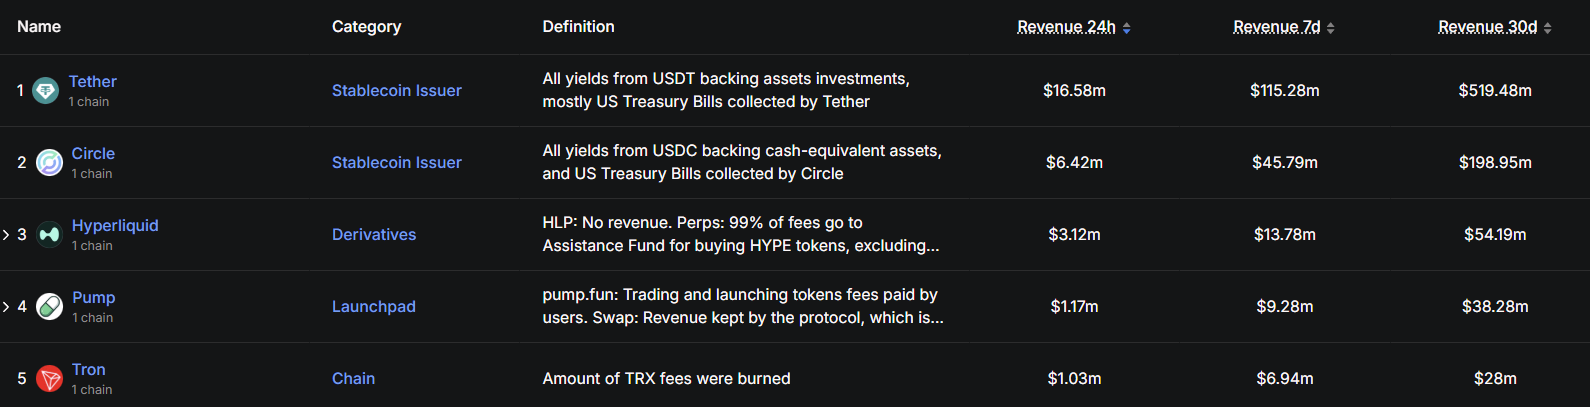
Source: Defillama
This places the platform ahead of major networks like Tron, and just behind heavyweights such as Tether, Circle, and Hyperliquid. Consistent fee generation at this scale reflects sustained user activity, strong demand for the protocol, and growing relevance within the broader crypto ecosystem — factors that often act as early signals ahead of longer-term price expansions.
Rounding Bottom Formation Takes Shape
From a technical perspective, the daily chart paints an increasingly constructive picture. PUMP appears to be forming a classic rounding bottom pattern, a bullish reversal structure that typically develops after a prolonged downtrend.
This pattern represents a gradual shift in market psychology. Instead of sharp V-shaped reversals driven by panic buying, rounding bottoms reflect steady accumulation, where selling pressure fades slowly and buyers begin to step in with increasing confidence.
Back in late October, PUMP faced heavy rejection near the $0.005475 neckline, triggering a sharp sell-off that extended for several weeks. That decline ultimately found a floor around $0.00170, a level that has since acted as a strong demand zone. Multiple defenses of this area prevented further downside, allowing the base of the rounding structure to form.
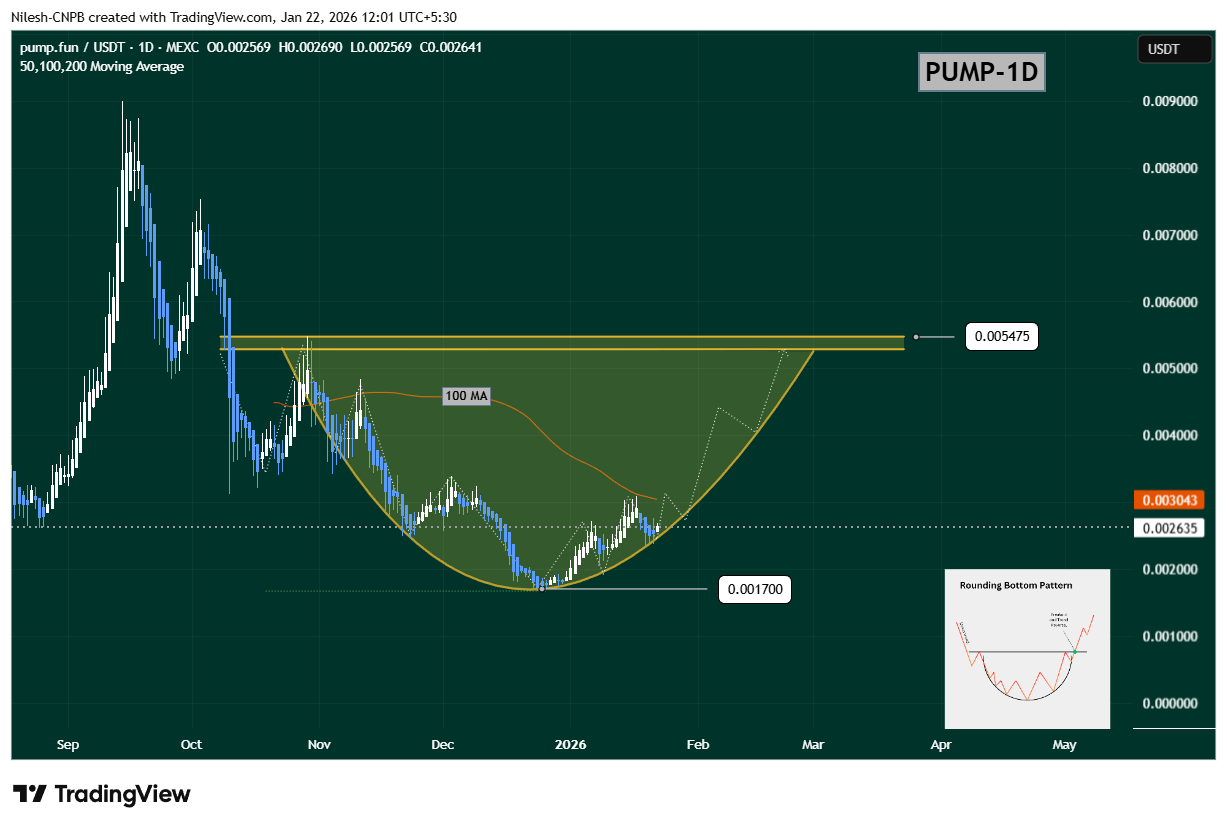
$PUMP Daily Chart/Coinsprobe (Source: Tradingview)
Since then, price action has begun to curve higher in a smooth arc — a key hallmark of a healthy bottoming process. The recent reclaim of the $0.0026 area further reinforces the idea that accumulation is underway and that market participants may be positioning ahead of a broader breakout.
What’s Next for PUMP?
For the bullish structure to gain stronger confirmation, PUMP needs to reclaim the 100-day moving average, currently sitting near $0.00304. A sustained close above this level would mark a clear shift in short-term momentum and signal that buyers are regaining control after months of corrective price action.
Looking further ahead, the most critical resistance remains the neckline near $0.005475. A decisive breakout above this zone would validate the entire rounding bottom formation and could open the door to a much broader bullish expansion. Such a move would likely attract momentum traders who have stayed on the sidelines during the prolonged downtrend.
Until then, some consolidation or minor pullbacks are possible, especially as price interacts with the 100-day moving average. However, as long as higher lows continue to form and the rounded base remains intact, the broader bullish structure stays valid.
Bottom Line
Pump.fun (PUMP) is quietly building a compelling recovery setup. Strong protocol revenues, combined with a textbook rounding bottom pattern on the daily chart, suggest that downside pressure may be fading and accumulation is taking place. While confirmation still hinges on reclaiming key resistance levels, the overall structure points toward increasing upside potential if broader market conditions remain supportive.
For now, PUMP looks less like a fading meme token — and more like a project preparing for its next meaningful move.
Disclaimer: The views and analysis presented in this article are for informational purposes only and reflect the author’s perspective, not financial advice. Technical patterns and indicators discussed are subject to market volatility and may or may not yield the anticipated results. Investors are advised to exercise caution, conduct independent research, and make decisions aligned with their individual risk tolerance.
About Author: Nilesh Hembade is the Founder and Lead Author of Coinsprobe, with over 5 years of experience in the cryptocurrency and blockchain industry. Since launching Coinsprobe in 2023, he has been providing daily, research-driven insights through in-depth market analysis, on-chain data, and technical research.
Disclaimer: The information on this page may come from third parties and does not represent the views or opinions of Gate. The content displayed on this page is for reference only and does not constitute any financial, investment, or legal advice. Gate does not guarantee the accuracy or completeness of the information and shall not be liable for any losses arising from the use of this information. Virtual asset investments carry high risks and are subject to significant price volatility. You may lose all of your invested principal. Please fully understand the relevant risks and make prudent decisions based on your own financial situation and risk tolerance. For details, please refer to
Disclaimer.
Related Articles
PI Jumps 16% After V20.2 Upgrade and AI Node Plans
Pi Network completed the V20.2 upgrade, ensuring node alignment and network stability for all operators.
AI node experiments tested decentralized computing, using spare node capacity to handle real AI tasks.
PI price jumped 16%, breaking resistance at $0.23, eyeing $0.28 as key target.
P
CryptoNewsLand25m ago
"Seeking a Sword by Marking a Boat" style coin price predictions go viral: the practical logic and flaws of mystical prophecies
Author: Frank, PANews
Whenever the market enters a confusing phase of stagnation, someone attempts to predict the next trend using a "cutting the cord at the boat" style of historical retrospection method. In such circumstances, people often see from these theories and charts that history is repeating itself, and seem to automatically overlap and verify future market movements with a certain period in the past.
This coincidence appears to have a magical effect and is often verified. Some bloggers claim that the accuracy rate of this type of prediction can reach 75%~80%.
Does this "cutting the cord at the boat" style price prediction that repeatedly goes viral on social media actually help the market identify phases, or is it packaging noise as prophecy?
From "Tick Fractals" to "History Rhymes"
The peak operation regarding the prediction of a market top in October 2025 comes from an analyst named CryptoBullet, who created a method called "tick
PANews35m ago
Bitcoin Holds Strong at $70,000! On-Chain Data Reveals "Collective Selling Wave," Retail Investors Emerge as Biggest Selling Pressure
Under Middle East geopolitical tensions, Bitcoin faced widespread selling pressure, particularly from retail holders. According to Glassnode data, the market is experiencing heavy selling pressure, with the accumulated trend score declining to 0.04, indicating that retail and small-to-medium investors are reducing their positions significantly. Despite this, Bitcoin's resilience against the decline has surprised market observers.
区块客36m ago
Bitcoin Early Warning of Stock Market Risk? Global Stock Market Turbulence Intensifies After BTC Drops to $60,000
Recently, analysts have pointed out that Bitcoin's price movements often lead traditional risk assets, reflecting the weakness in global stock markets. After experiencing volatility, Bitcoin is currently stabilizing around $70,000, with market sentiment being affected by geopolitical tensions and rising oil prices. Historical data shows that Bitcoin often exhibits signs of peaking before stock market corrections, and investors are beginning to regard it as an important indicator for monitoring risk asset sentiment.
GateNews39m ago
Analyst: Bitcoin Has Transitioned from Distribution Phase to Accumulation Phase, Selling Pressure Drops to One-Sixth of Cycle Average
CryptoQuant analysts indicate that the market is currently in a neutral accumulation phase, with selling pressure dropping to historic lows, but may face long-term consolidation risks, requiring attention to the lack of price catalysts.
GateNews41m ago
Dogecoin Tests Fibonacci Barrier as Weak Momentum Builds Risk
Key Insights
Dogecoin price approaches a confluence of Fibonacci resistance and value area high, creating a strong technical barrier that traders closely monitor.
The latest rally shows weakening momentum, suggesting the upward move may rely more on liquidations than sustained buying
CryptoFrontNews45m ago