Virtual Protocol (VIRTUAL) just experienced one of the strongest short-term rallies in the recent market recovery. At press time, the price of VIRTUAL has increased by 16% over the past 24 hours and is trading at $0.579.
This growth occurred amid improved market liquidity and growing confidence that the overall cryptocurrency market may be entering a new recovery phase. However, spot trading volume has dropped sharply, down 36% to $110 million, raising questions among investors about the sustainability of this upward trend.
Capital inflows versus trading volume on Binance
VIRTUAL’s trading activity is currently mainly focused on the perpetual futures market, where capital flows have increased significantly.
According to data from CoinGlass, open interest—the measure of committed capital in perpetual contracts—has risen by 17%, reaching $55 million. This indicates that investors are becoming more confident and willing to use leverage to speculate on future price movements, whether long or short.
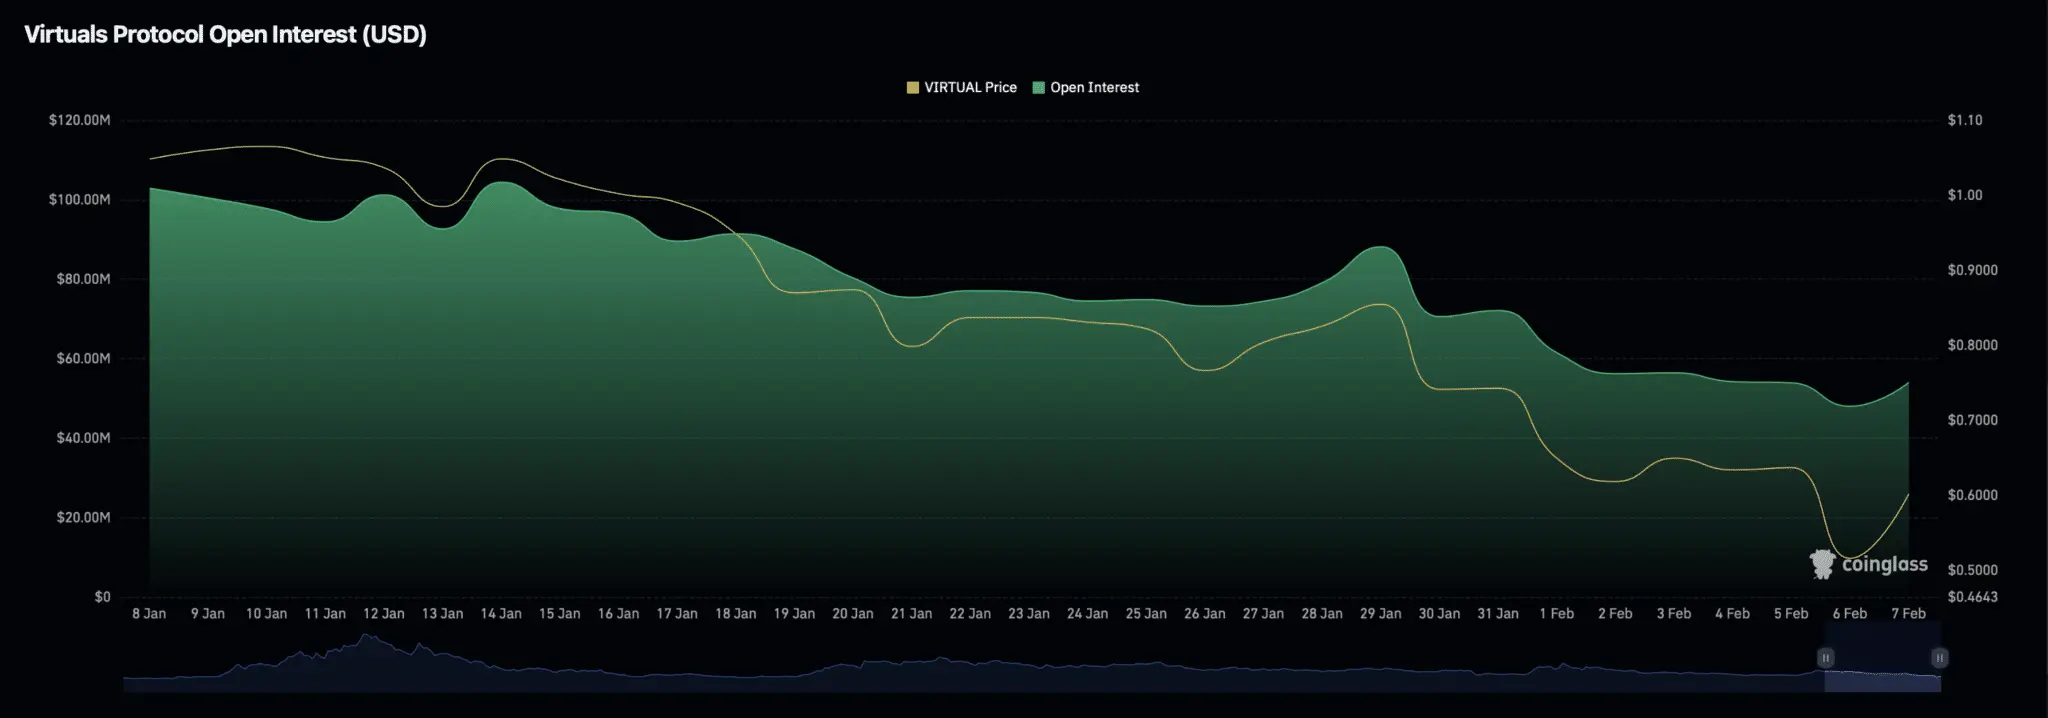 Source: CoinGlassNotably, as the price rises, liquidations are primarily affecting short positions, suggesting that most new capital is concentrated in long positions. Data also shows that the ratio between long and short positions across the entire market remains above 1, specifically at 1.012, indicating buyers hold an advantage in futures trading volume.
However, data from Binance presents a different perspective. Binance, which accounts for a large share of VIRTUAL’s liquidity in the derivatives market, recorded $12.6 million in open contracts and $56.01 million in trading volume. On this platform, the long-to-short ratio is only 0.732, reflecting a dominance of traders placing sell (short) orders.
This discrepancy suggests that traders on Binance could exert downward pressure if selling momentum continues to increase.
Technical structure and key support levels
Currently, VIRTUAL is trading near a significant demand zone on the daily chart. Historically, this price zone has repeatedly served as a foundation for strong recoveries, with three notable rebounds from this support level.
However, if the price cannot hold this critical support, VIRTUAL risks falling further, with the next target at $0.28—representing approximately a 48% decline.
The price chart is also forming a descending channel, defined by a downward-sloping resistance line and a stable support line. This structure often signals the potential for a breakout, especially as the gap between the two lines narrows.
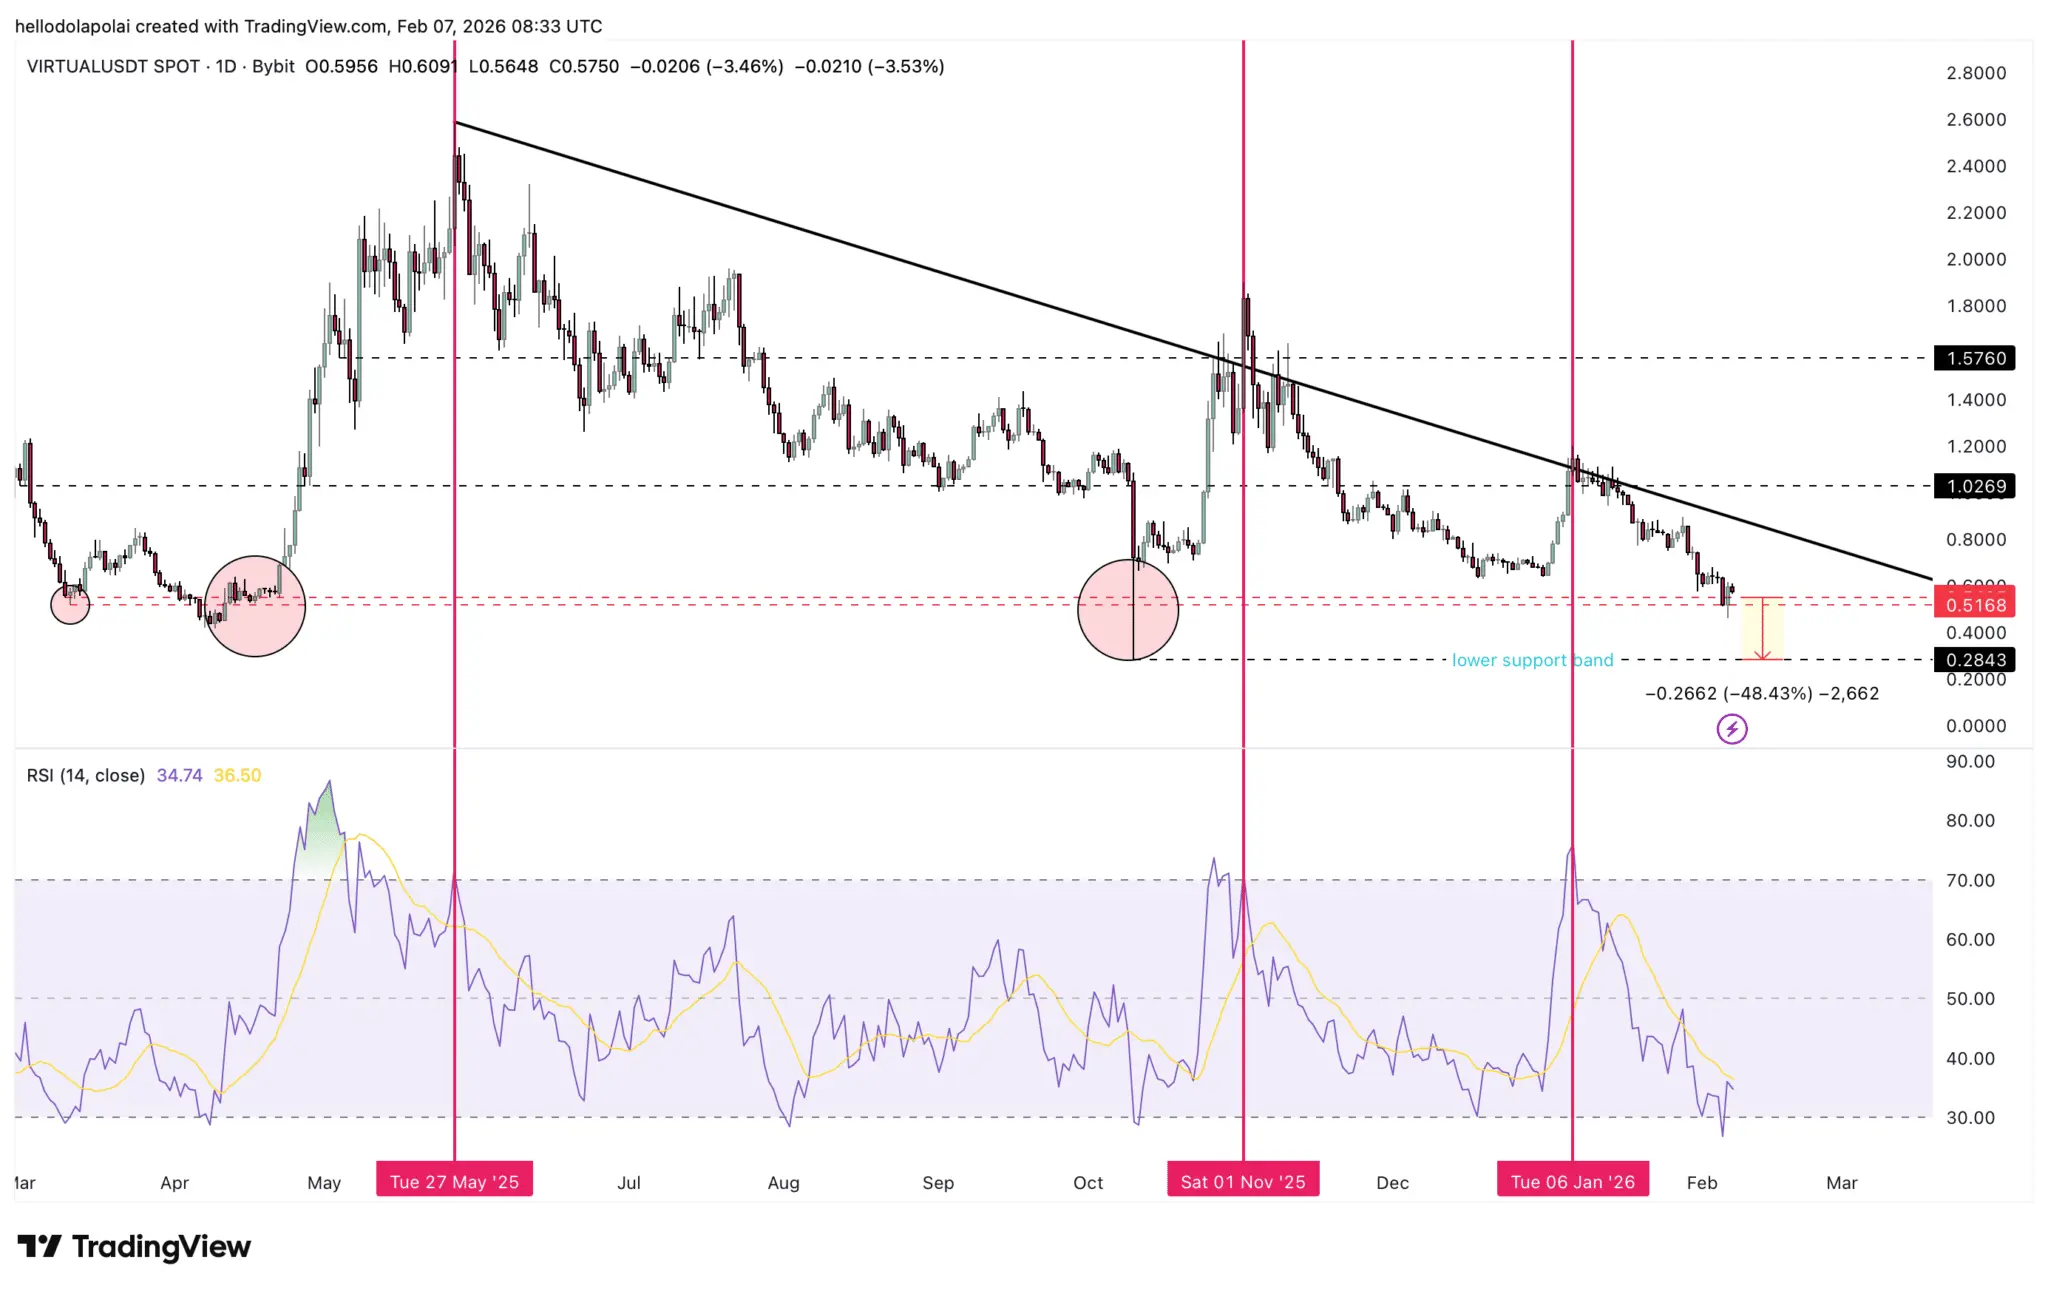 Source: TradingViewMomentum indicators are showing positive signals. The Relative Strength Index (RSI), a tool measuring the speed and magnitude of price movements, has recovered from oversold levels. This suggests increasing buying pressure and positive momentum signals.
In previous cycles, when RSI recovered from oversold conditions, strong bullish rallies often followed, pushing the index into overbought territory. However, in past instances, the price failed to break through the descending resistance line. Currently, with the price approaching this resistance, a breakout seems highly likely, opening the possibility for VIRTUAL to reach the $1 mark.
Overall altcoin market context
Although VIRTUAL has recently experienced a significant increase, the overall altcoin market remains weak.
The Altcoin Index—an indicator of altcoin performance relative to Bitcoin on a scale from 0 to 100—is currently only at 26 at press time. This reflects that altcoins, including VIRTUAL, are still underperforming compared to Bitcoin.
Until market sentiment improves and this index surpasses the 50 threshold, the long-term growth prospects for the entire altcoin market, including VIRTUAL, will remain limited.
Disclaimer: The information on this page may come from third parties and does not represent the views or opinions of Gate. The content displayed on this page is for reference only and does not constitute any financial, investment, or legal advice. Gate does not guarantee the accuracy or completeness of the information and shall not be liable for any losses arising from the use of this information. Virtual asset investments carry high risks and are subject to significant price volatility. You may lose all of your invested principal. Please fully understand the relevant risks and make prudent decisions based on your own financial situation and risk tolerance. For details, please refer to
Disclaimer.