Decred (DCR) is maintaining an impressive breakout momentum, increasing by an additional 5% at the time of writing on Monday, marking its fifth consecutive rally. This upward trend occurs amid bullish efforts to challenge a key resistance zone in the market.
Notably, the limited circulating supply—stemming from continuous user staking and persistent treasury accumulation—is creating significant upward pressure on DCR’s price. From a technical perspective, Decred is at a critical juncture, as increasing buying pressure could determine the next direction of the trend.
Limited Supply Drives DCR Demand
On-chain data shows that 10.9 million DCR are currently staked, accounting for 67.4% of the total mined supply (16.2 million DCR) and locked for 142 days. Additionally, the treasury holds over 873,000 DCR, removing another 5.4% from the circulating supply and reducing actual market liquidity to approximately 4.40 million DCR. This scarcity of supply is significantly boosting demand, attracting increasing investor interest in this privacy-focused coin.
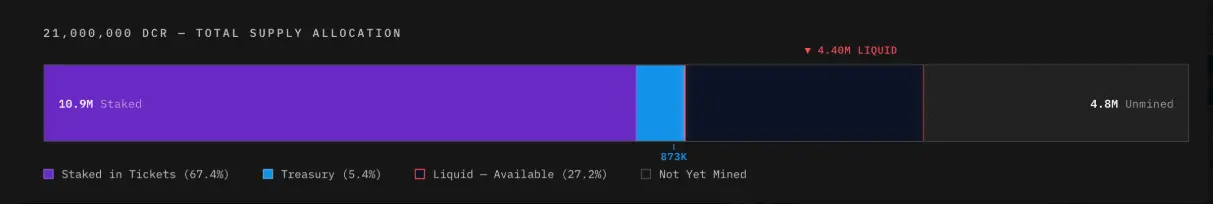 DCR Supply Distribution | Source: Decred.supply## Technical Outlook: Will Decred Continue Its Uptrend?
Decred has gained about 5% at the time of writing on Monday, breaking above the $25.00 level. The short-term recovery is currently challenging the 38.2% Fibonacci retracement at $26.13, calculated from the November 4 high of $70 down to the December 23 low of $14.21. This is a key resistance zone that has repeatedly halted upward attempts since late November, reflecting ongoing significant selling pressure.
If the price can convincingly close above the $26.13 level, the bullish trend may be reinforced, opening the door toward higher Fibonacci retracement levels at $31.54 (50%) and $38.07 (61.8%).
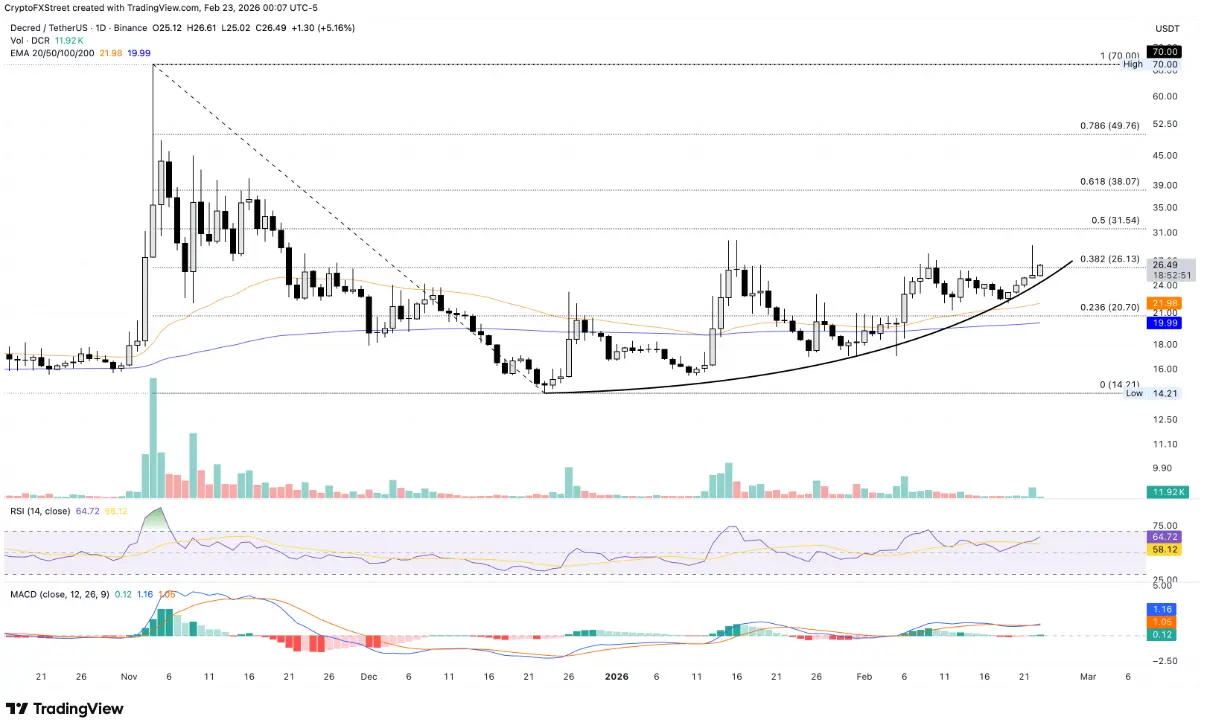 Daily DCR/USDT Chart (Logarithmic) | Source: TradingView In terms of momentum, the Relative Strength Index (RSI) on the daily timeframe is around 63 and continues to rise, indicating increasing buying strength and a sustained recovery from the neutral zone. More importantly, the RSI still has room to grow before entering overbought territory, supporting the scenario of continued price advancement. Additionally, the MACD line has crossed above the signal line, signaling positive momentum and the potential formation of a new bullish impulse.
Conversely, if the price fails to break above and reverses from the $26.13 zone, a correction scenario could unfold, with Decred retreating to test the 50-day Exponential Moving Average (EMA) around $21.96.
Disclaimer: The information on this page may come from third parties and does not represent the views or opinions of Gate. The content displayed on this page is for reference only and does not constitute any financial, investment, or legal advice. Gate does not guarantee the accuracy or completeness of the information and shall not be liable for any losses arising from the use of this information. Virtual asset investments carry high risks and are subject to significant price volatility. You may lose all of your invested principal. Please fully understand the relevant risks and make prudent decisions based on your own financial situation and risk tolerance. For details, please refer to
Disclaimer.
Related Articles
Will XRP Hold $1.33 or Extend Toward $1.30 Before Rebound?
XRP is currently trading at $1.35, experiencing a 1.3% decline. Key support is at $1.34, while resistance is at $1.40. The price is testing around the Fibonacci levels of $1.33 and $1.30, crucial for potential upward movement or deeper decline.
CryptoNewsLand8m ago
Dogecoin Monthly Breakdown Pattern Reappears as Price Tests $0.0918
Dogecoin is currently trading at $0.09205 at a gain of 2.3, with support of above $0.08878.
As can be seen in the monthly chart, there are recurring breakdown areas that have been followed by significant expansions in price.
The short-term trading range is narrow and the immediate point o
CryptoNewsLand11m ago
Solana Nears $95 Resistance With $17B Volume Surge
Solana approaches a key resistance level near $95, with increased trading volume and open interest signaling active trader interest. The token is currently at $90.20, facing potential upward movement if it surpasses $95, but may test $85 if rejected.
CryptoFrontNews36m ago
Bitcoin Slips to $68,000 as Middle East Conflict and US Jobs Data Trigger Sell-Off
Bitcoin surrendered its $70,000 support level, triggering a broader crypto market retreat that wiped out $329 million in leveraged positions. This downturn was fueled by a perfect storm of geopolitical and macroeconomic pressures.
Wiping out the ‘War Gains’
Bitcoin’s midweek resilience
Coinpedia37m ago
PEPE Hovers at Critical $0.053414 Support as $432M Volume Surge Tightens Breakout Watch
PEPE is trading at $0.053416, just above support at $0.053414, with significant trading volume up 22.14%. Resistance is at $0.053676. Despite a slight decrease in price, there’s increased market activity, suggesting potential volatility.
CryptoNewsLand1h ago
DXY Retest at 99.183: Will 100–101 Break as US Degen Index Stabilizes?
DXY trades at 99.183 while retesting the 100–101 monthly resistance zone.
US Degen Index 6900 sits at $0.0001197 with support at $0.0001175 and resistance at $0.0001214.
A break above 101 on DXY would shift structure higher, while rejection keeps price below key resistance.
The U.
CryptoNewsLand1h ago