
Altcoins have been stuck in the shadow of Bitcoin for years. Since the 2021 cycle peak, altcoin dominance has been in a steady downtrend.
Every rally attempt failed. Every breakout faded. Capital kept flowing back into BTC. For many investors, it has felt like a long grind with no real relief.
But now, one chart is starting to look very different.
Crypto Patel shared a long-term altcoin dominance chart that shows a five-year descending trendline nearing a break.
More importantly, the MACD on the higher timeframe is about to print a bullish cross, the same type of signal that appeared before the 2020–2021 altcoin explosion.
Looking at the chart, altcoin dominance has respected a falling resistance line since the previous cycle high. Every time dominance pushed into that trendline, sellers stepped in.
Now price is pressing against it again. The structure shows repeated higher lows forming near support while resistance has remained flat.
That compression matters. When a market spends years building pressure under a descending line, the eventual break can be aggressive.
The chart even highlights previous “altseason start” zones in 2017 and 2020. Both were preceded by similar compression phases.
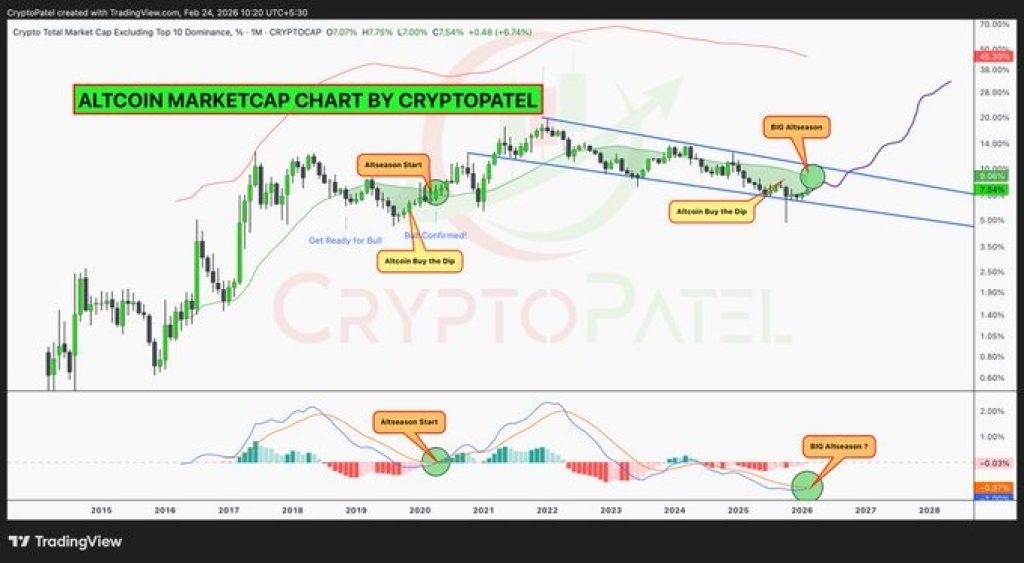
Source: X/CryptoPatel
However, below the chart, the MACD indicator is turning higher.
In both 2017 and 2020, a bullish MACD cross on the higher timeframe aligned with altcoin dominance breaking upward. What followed were massive expansions across the alt market, with many coins posting 10x to 20x moves.
Right now, the MACD is curling up again.
Volatility has been contracting for months. Dominance is sitting near a key inflection point. Liquidity appears to be building above current levels. This type of setup does not guarantee an explosion, but historically, this is how they begin.
_****Pi Network Posts Record Growth Metrics, So Why Does the Pi Coin Chart Look Dead?**
However, Altcoin dominance represents how much of the total crypto market cap is allocated outside of Bitcoin. When dominance rises, it means capital is rotating into altcoins.
For years, Bitcoin has controlled the narrative. But if dominance breaks this five-year trendline, it would signal a shift in market structure.
That shift is what traders call “altseason.”
It does not happen overnight. It starts quietly, often when sentiment is still skeptical.
Early or Late?
The chart does not promise 20x moves. Markets do not repeat perfectly.
But the technical structure looks similar to previous cycle turning points. A multi-year downtrend is being tested. Momentum is turning. Compression is extreme.
If dominance breaks and holds above resistance, the rotation into altcoins could accelerate quickly. After five years of underperformance, altcoins are back at a decision point.
Whether this becomes the next explosive phase or another fakeout depends on one thing: can dominance finally close above that long-standing resistance?
If it does, the market structure changes.
Disclaimer: The information on this page may come from third parties and does not represent the views or opinions of Gate. The content displayed on this page is for reference only and does not constitute any financial, investment, or legal advice. Gate does not guarantee the accuracy or completeness of the information and shall not be liable for any losses arising from the use of this information. Virtual asset investments carry high risks and are subject to significant price volatility. You may lose all of your invested principal. Please fully understand the relevant risks and make prudent decisions based on your own financial situation and risk tolerance. For details, please refer to
Disclaimer.
Related Articles
Here’s Why The Crypto Market Is Up Today
The crypto market is in the greens today. In the past day, the total market cap has climbed by about 3.37%, now sitting around $2.43 trillion. It’s not just small coins, the big names are leading the move.
Bitcoin is up about 4.2%, trading near $71,200. Ethereum has gained over 5%, while
CaptainAltcoin19m ago
Crypto Market Indicates Recovery Despite Consistent Fear
The crypto market shows recovery with a $2.4T capitalization and a notable 1.99% increase. Bitcoin rises by 2.43% and Ethereum by 3.49%. Significant gains are seen in select altcoins, while DeFi and NFT sectors also experience growth.
BlockChainReporter35m ago
Trump's Ultimatum to Iran Fails to Materialize, BTC Stabilizes After Breaking Below $70,000 Over the Weekend
QCP Group points out that Trump's ultimatum to Iran failed to materialize, and the market stabilized briefly. Despite BTC breaking below 70,000, its resilience has strengthened. With U.S. national debt exceeding 3.9 trillion, stagflation concerns intensify, and central banks face policy dilemmas. Iran proposed settling transit fees in yuan, and the market should monitor shifts in BTC.
GateNews1h ago
Crypto Analyst Hints at ADA Price Uptick Based on Weekly Chart
Crypto analyst Ali Charts predicts a potential rise in ADA prices, currently up 5.50% in the last 24 hours. He suggests the token may surge further over the next three months based on historical price patterns and current market analysis.
TheNewsCrypto1h ago
BCH Shows Promising Buy Signal Traders Can’t Ignore
BCH holds key $440 support, showing potential for a short-term rebound.
The 4-hour chart indicates bullish flip with strong OBV and DMI signals.
Next targets lie at $494, $510, and possibly $570 if Bitcoin rises further.
Bitcoin Cash — BCH, has captured traders’ attention this week with
CryptoNewsLand1h ago
QNT Rally Tests a Crucial Supply Zone — What Next for Quant?
QNT rallied 24% weekly, testing a key supply zone near $80–$88.
Daily closes above $88 signal bullish continuation, while drops below $75 indicate renewed bearish pressure.
Short-term momentum is positive, but higher timeframe indicators suggest cautious trading.
Quant — QNT, has
CryptoNewsLand1h ago
