Ethereum (ETH) broke above the $2,100 mark on Thursday trading, aligning with the widespread market recovery across the cryptocurrency space.
The rally of the largest altcoin in the market is accompanied by a surge in open interest (OI), which now stands at 13.43 million ETH — the highest since January 31. Since February 19, ETH’s OI has steadily increased, adding 1.2 million ETH in just two weeks. This development occurs amid the market recording $152 million in ETH liquidations over the past 24 hours, with short positions accounting for up to $129 million, according to data from Coinglass.
Open interest reflects the total value of unsettled derivative contracts. The rising indicator suggests investors are actively rebuilding their positions rather than staying on the sidelines.
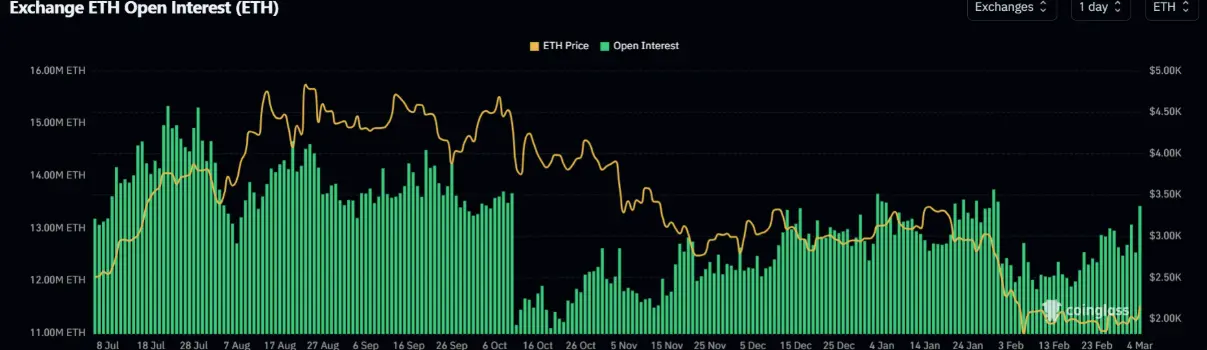 ETH Open Contract Volume | Source: CoinglassHowever, market sentiment remains uncertain. ETH’s funding rate continues to fluctuate between negative and positive, indicating a tug-of-war between bulls and bears.
In another notable development, ETH is approaching the on-chain average cost basis of investors (realized price) around $2,300. Historically, whenever prices near this level, the market often experiences short-term distribution pressure as some investors take profits at breakeven. However, if ETH can break through and sustain above $2,300, this level could transform into a significant support zone for the next trend.
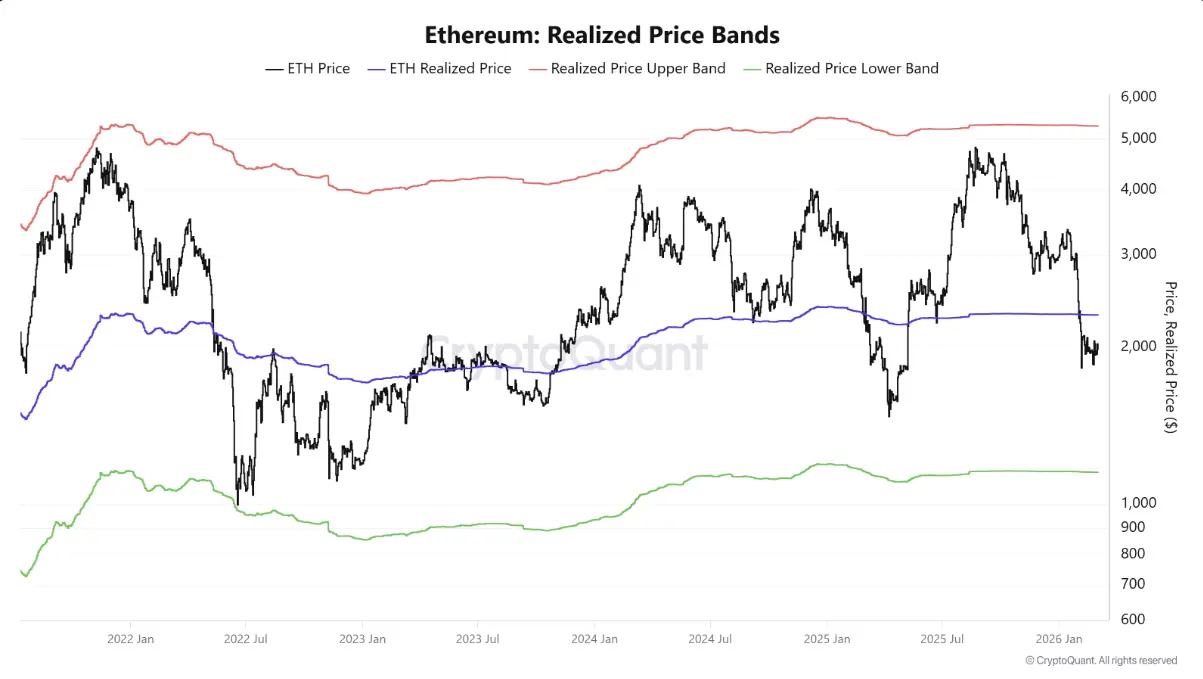 ETH Realized Price | Source: CryptoQuantETH’s recovery also occurs amid improved risk appetite, following a report by The New York Times that Iranian intelligence agents have indirectly contacted U.S. intelligence agencies to propose a ceasefire agreement — a development that helps ease geopolitical tensions and boosts market sentiment.
Ethereum Price Forecast: ETH Breaks Resistance at $2,108, Heading Toward 50-Day EMA
On the daily chart, ETH is oscillating around $2,150, signaling initial recovery signs. The short-term trend has slightly turned positive as the price remains above the 20-day exponential moving average (EMA) — which had been flat but is now beginning to rise, indicating a shift from correction to early recovery. However, the overall picture remains under pressure as the 50-day EMA, trending downward around $2,298, continues to act as a notable resistance.
The RSI stands at 53, crossing above the neutral threshold, suggesting increasing bullish momentum after the previous oversold condition. Nonetheless, the Stochastic Oscillator (Stoch) has moved deep into overbought territory near 91, implying the short-term rally may be somewhat “hot,” and any correction could be more of a technical pullback rather than a sharp decline.
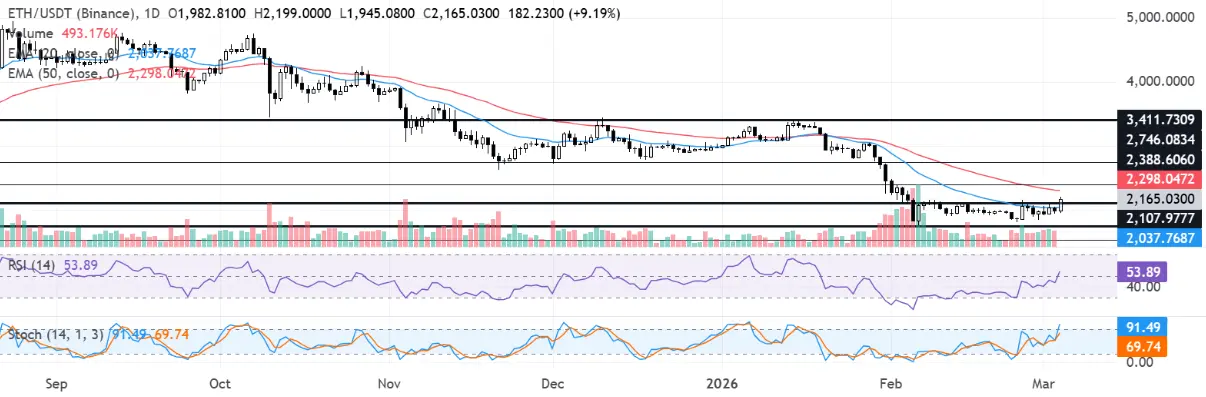 ETH/USD Daily Chart | Source: TradingViewFrom a technical perspective, the $2,108 level is the nearest support — where the price converges with the upward-sloping 20-day EMA. Losing this level could see ETH retreat to around $1,741 before testing lower support at $1,524. On the upside, the first resistance is at $2,390, just below the 50-day EMA, serving as a critical test for the nascent rebound. Further targets include $2,746 and $3,411 if bulls maintain their dominance.
As long as ETH stays above $2,108, the short-term bullish structure remains intact. Conversely, a close below this level could weaken the recovery momentum and shift market focus back to lower support zones.
Disclaimer: The information on this page may come from third parties and does not represent the views or opinions of Gate. The content displayed on this page is for reference only and does not constitute any financial, investment, or legal advice. Gate does not guarantee the accuracy or completeness of the information and shall not be liable for any losses arising from the use of this information. Virtual asset investments carry high risks and are subject to significant price volatility. You may lose all of your invested principal. Please fully understand the relevant risks and make prudent decisions based on your own financial situation and risk tolerance. For details, please refer to
Disclaimer.
Related Articles
Bitcoin and Ethereum ETFs Record Daily Outflows While Maintaining Weekly Gains
Gate News bot message, according to the March 6 update, Bitcoin ETFs recorded a daily net outflow of 1,697 BTC (valued at $116.94 million), while maintaining a 7-day net inflow of 13,014 BTC (valued at $896.69 million). Ethereum ETFs showed a daily net outflow of 3,185 ETH (valued at $6.34 million),
GateNews1h ago
"Brother Maqi" deposits $210,000 into HyperLiquid to increase ETH long position by more than 25 times
Gate News Report, March 6, according to Onchain Lens monitoring, "Big Brother MaJie" deposited $210,000 USDC into HyperLiquid to increase his ETH 25x long position. Previously, as the market declined, "Big Brother MaJie" had closed most of his positions at a loss, and his unrealized loss has now exceeded $29.7 million.
GateNews1h ago
ETH drops below 2000 USDT, 24H decline of 5.68%
Gate News Report, March 6th, according to data from a certain CEX market, ETH dropped below 2000 USDT, currently at 1999.87 USDT, down 5.68% in the past 24 hours.
GateNews3h ago
Short-selling firm Culper releases bearish report on Ethereum: Fusaka upgrade disrupts ETH token economics
Aggressive short-selling firm Culper Research has released a report bearish on Ethereum (ETH), believing that the Fusaka upgrade in 2025 will cause structural damage to ETH's token economy. The report points out that a significant decrease in Gas fees has led to increased address pollution attacks and reduced validator rewards, and emphasizes that Ethereum is facing competitive pressure from Solana and L2 solutions. Culper believes that ETH's value capture ability is declining and has started shorting ETH.
ChainNewsAbmedia3h ago
ETH drops below 2000 USDT
Gate News bot message, Gate market display, ETH drops below 2000 USDT, current price 1998.74 USDT.
CryptoRadar3h ago
ETH 15-minute sharp decline of 1.53%: Large investors' short-term profit-taking and ETF capital outflows resonate, triggering a significant drop
From 13:45 to 14:00 on March 6, 2026 (UTC), ETH experienced a significant fluctuation, with a short-term decline of 1.53%. The price fluctuated sharply between 2019.21 and 2051.26 USDT, with an amplitude of 1.56%. High-frequency sell orders surged, market attention spiked, trading volume increased, and the divergence between bulls and bears intensified. Market sentiment became more cautious.
The main driving force behind this fluctuation was large investors and whale accounts reducing their positions after a short-term rebound, leading to a rapid release of large sell orders and triggering short-term selling pressure in the market. On the ETF front, holdings
GateNews3h ago