Trade
Basic
Futures
Futures
Hundreds of contracts settled in USDT or BTC
Options
HOT
Trade European-style vanilla options
Unified Account
Maximize your capital efficiency
Demo Trading
Futures Kickoff
Get prepared for your futures trading
Futures Events
Participate in events to win generous rewards
Demo Trading
Use virtual funds to experience risk-free trading
Earn
Launch
CandyDrop
Collect candies to earn airdrops
Launchpool
Quick staking, earn potential new tokens
HODLer Airdrop
Hold GT and get massive airdrops for free
Launchpad
Be early to the next big token project
Alpha Points
NEW
Trade on-chain assets and enjoy airdrop rewards!
Futures Points
NEW
Earn futures points and claim airdrop rewards
Investment
Simple Earn
Earn interests with idle tokens
Auto-Invest
Auto-invest on a regular basis
Dual Investment
Buy low and sell high to take profits from price fluctuations
Soft Staking
Earn rewards with flexible staking
Crypto Loan
0 Fees
Pledge one crypto to borrow another
Lending Center
One-stop lending hub
VIP Wealth Hub
Customized wealth management empowers your assets growth
Private Wealth Management
Customized asset management to grow your digital assets
Quant Fund
Top asset management team helps you profit without hassle
Staking
Stake cryptos to earn in PoS products
Smart Leverage
NEW
No forced liquidation before maturity, worry-free leveraged gains
GUSD Minting
Use USDT/USDC to mint GUSD for treasury-level yields
More
Solana (SOL) News Today
Latest crypto news and price forecasts for SOL: Gate News brings together the latest updates, market analysis, and in-depth insights.
Solana Price Prediction 2026: ETPs Recorded $47B Inflow in 2025, DeepSnitch AI Followed With Over...
Exchange-traded products (ETPs), particularly those backed by Ethereum, XRP, and Solana, recorded over $47 billion in inflows in 2025, just below their gross total the previous year. Meanwhile, inflows into Bitcoin-backed funds fell 35%
One crypto product that saw a notable influx of capital was
BlockChainReporter·1h ago
Morgan Stanley Files for Bitcoin and Solana ETFs
Morgan Stanley has filed with the SEC to launch Bitcoin and Solana ETFs, transitioning from distribution to in-house fund management. The Bitcoin trust will hold spot BTC, while the Solana trust will include staking rewards, signaling increased institutional adoption in the crypto space.
CryptoFrontNews·2h ago
Jupiter Rolls Out JupUSD as Capital-Efficient Stablecoin for Solana Ecosystem Backed by BlackRock’s BUIDL Fund
Upon launching the JupUSD stablecoin, Jupiter said that 90% of its reserves are held in USDtb, a licensed, GENIUS-compliant stablecoin backed by BlackRock’s BUIDL fund.
JupUSD is integrated across the DEX’s ecosystem, thereby making it a unified stablecoin settlement layer on the platform.
S
CryptoNewsFlash·6h ago
Morgan Stanley Files with the SEC to Launch Bitcoin and Solana ETFs for Wealth Clients
Morgan Stanley files for Bitcoin and Solana ETFs to offer crypto access to 19 million wealth clients.
Early 2026 inflows show strong demand for regulated crypto funds at the start of the year.
Major banks expand crypto offerings as advisors can now recommend ETFs to broader
CryptoNewsLand·7h ago
Solana Treasury Firm DeFi Dev Corp. Ventures Into Yield Farming - Coinspeaker
Key Notes
DeFi Dev Corp.
plans to put its SOL treasury to work instead of keeping the assets sitting idle.
The company will use Hylo’s yield strategies to compound SOL, support operational needs, and gain exposure to incentive programs.
Hylo has scaled to over $100 million in total value
Coinspeaker·7h ago
Morgan Stanley Moves Deeper into Crypto, Proposes BTC and SOL ETFs
US investment bank Morgan Stanley has filed with the U.S. Securities and Exchange Commission (SEC) to launch two exchange-traded funds (ETFs) linked to Bitcoin (BTC) and Solana (SOL)
Submitted on 6 January 2026, the filings mark a significant step for one of the largest U.S. banks, moving from
DailyCoin·8h ago
PumpFun Breaks $2 Billion in Daily Trading Volume on Solana
The decentralized finance sector reached a historic milestone on January 6, 2026, when Solana-based memecoin launchpad PumpFun officially surpassed $2 billion in daily trading volume. The figure represents a nearly 150% increase compared to the previous week’s average and stands as the highest
ICOHOIDER·9h ago
Can This Meme Coin Presale Hit 50x? Solana and Avalanche Investors Are Doubling Down This Q1
Solana just hit fresh highs at $294 in January 2025, Avalanche secured a $675 million institutional deal, and both chains are climbing hard into Q1 2026. But while SOL and AVAX holders celebrate their gains, something unexpected is happening. A wave of profit-takers from these Layer-1 giants are
BlockChainReporter·10h ago
The first major bank in the US to join the fight! Morgan Stanley applies to launch Bitcoin and Solana ETFs
According to documents filed with the U.S. Securities and Exchange Commission (SEC), Wall Street investment bank Morgan Stanley officially submitted registration statements on Tuesday to launch Bitcoin and Solana (SOL) spot ETFs, becoming the first major bank in the U.S. to heavily deploy cryptocurrency asset ETFs.
The documents show that Morgan Stanley submitted two S-1 registration statements: "Morgan Stanley Bitcoin Trust" and "Morgan Stanley Solana Trust." Among them, the Solana ETF incorporates a staking mechanism, meaning that in the future, the fund will not only track the coin price but also provide investors with additional income opportunities.
Morgan Stanley currently manages approximately $6.4 trillion in assets. If the ETF
区块客·11h ago
Solana in 2025: $2.4 billion invested, DEX trading volume exceeds $1.5 trillion. Where is the next stop?
In 2025, Solana delivered a phenomenal annual performance report, with multiple core metrics reaching new all-time highs, marking its evolution from a high-throughput technological narrative to a mature financial ecosystem with a solid economic foundation. The total revenue of applications built on Solana for the year reached $2.39 billion, a 46% increase year-over-year; the total trading volume on decentralized exchanges surpassed $1.5 trillion, a 57% growth.
Meanwhile, the network's daily active wallets reached 3.2 million, the stablecoin supply soared to $14.8 billion, while the average transaction fee dropped to $0.017. These data collectively paint a picture: Solana has not only achieved a significant leap in scale but also made substantial breakthroughs in revenue generation, asset accumulation, and institutional adoption, establishing its position as a top trading and innovation platform in the crypto world.
MarketWhisper·15h ago
Why 114514 Meme Coin Is Leading the Japanese Subculture Rally on Solana in 2026
The 114514 meme coin has taken the cryptocurrency world by storm, emerging as a standout token on the Solana blockchain amid a resurgence of Japanese subculture-driven trends.
CryptopulseElite·15h ago

[Spot ETF] XRP·SOL continuous inflow for 6 consecutive trading days, DOGE·LTC·HBAR stagnate
In the US altcoin spot ETF market, XRP and Solana continue their streak of inflows, while Dogecoin, Litecoin, and Hedera show stagnant capital.
According to SosoValue, as of January 6 (local time), the US XRP spot ETF market experienced a total daily net inflow of $19.12 million.
Since December 29, it has maintained inflows for six consecutive trading days, with the total net inflow expanding to $1.25 billion.
▲Franklin XRPZ ($7.35 million) ▲Canary XRPC ($6.49 million) ▲Bitwise XRP ($3.54 million) ▲Grayscale GXRP ($1.75 million) confirmed net inflows, while ▲21Shares TOXR showed no change in capital flow.
The total trading volume was $58.92 million, and the total net asset size of XRP spot ETFs reached 16
TechubNews·15h ago
U.S. banking giant takes the first shot! Morgan Stanley applies for Bitcoin and Solana spot ETFs for the first time
Morgan Stanley Breaks New Ground as the First Major U.S. Bank to Apply for Spot Bitcoin and Solana ETFs, Supporting Staking Yields. Benefiting from Regulatory Relaxation and Market Demand, Total Crypto ETF Trading Volume Has Surpassed $2 Trillion.
Morgan Stanley Applies for Spot Bitcoin and Solana ETFs for the First Time
------------------------
With assets under management reaching up to $6.4 trillion, the Wall Street giant Morgan Stanley
CryptoCity·16h ago
Jito launches IBRL.wt, reveals controversial validator behaviors on Solana
The IBRL.wtf tool by Jito sparks debate among Solana validators by assessing their performance and behavior through a synthesized score. It highlights late packing, where validators delay transactions for personal gain, potentially harming network efficiency. While not a definitive measure, it signals healthy behavior; some validators excel while others face criticism. The evaluation method faces resistance from rival block builders.
TapChiBitcoin·17h ago
Solana ecosystem ignites another Meme frenzy: 114514 surges nearly 1000% in a single day, PENGU and BONK soar together
In early 2026, the Meme coin market in the Solana ecosystem kicked off with a remarkable collective surge. Originating from Japan's internet culture, 114514 became the biggest dark horse, with a single-day increase of up to 992%. An early investor made an astonishing return of over 2.18 million USD within 11 days with a cost of 321 USD.
Meanwhile, the NFT-based Meme coins PENGU and veteran-level player BONK recorded weekly gains of over 45% and 57%, respectively, jointly pushing the total market capitalization of Meme coins on the Solana chain to approximately 6.83 billion USD. This feast driven by cultural consensus and community enthusiasm once again highlights Solana's ecological vitality as an innovative hotbed for Meme coins, but also rings the alarm for market speculation risks.
MarketWhisper·17h ago
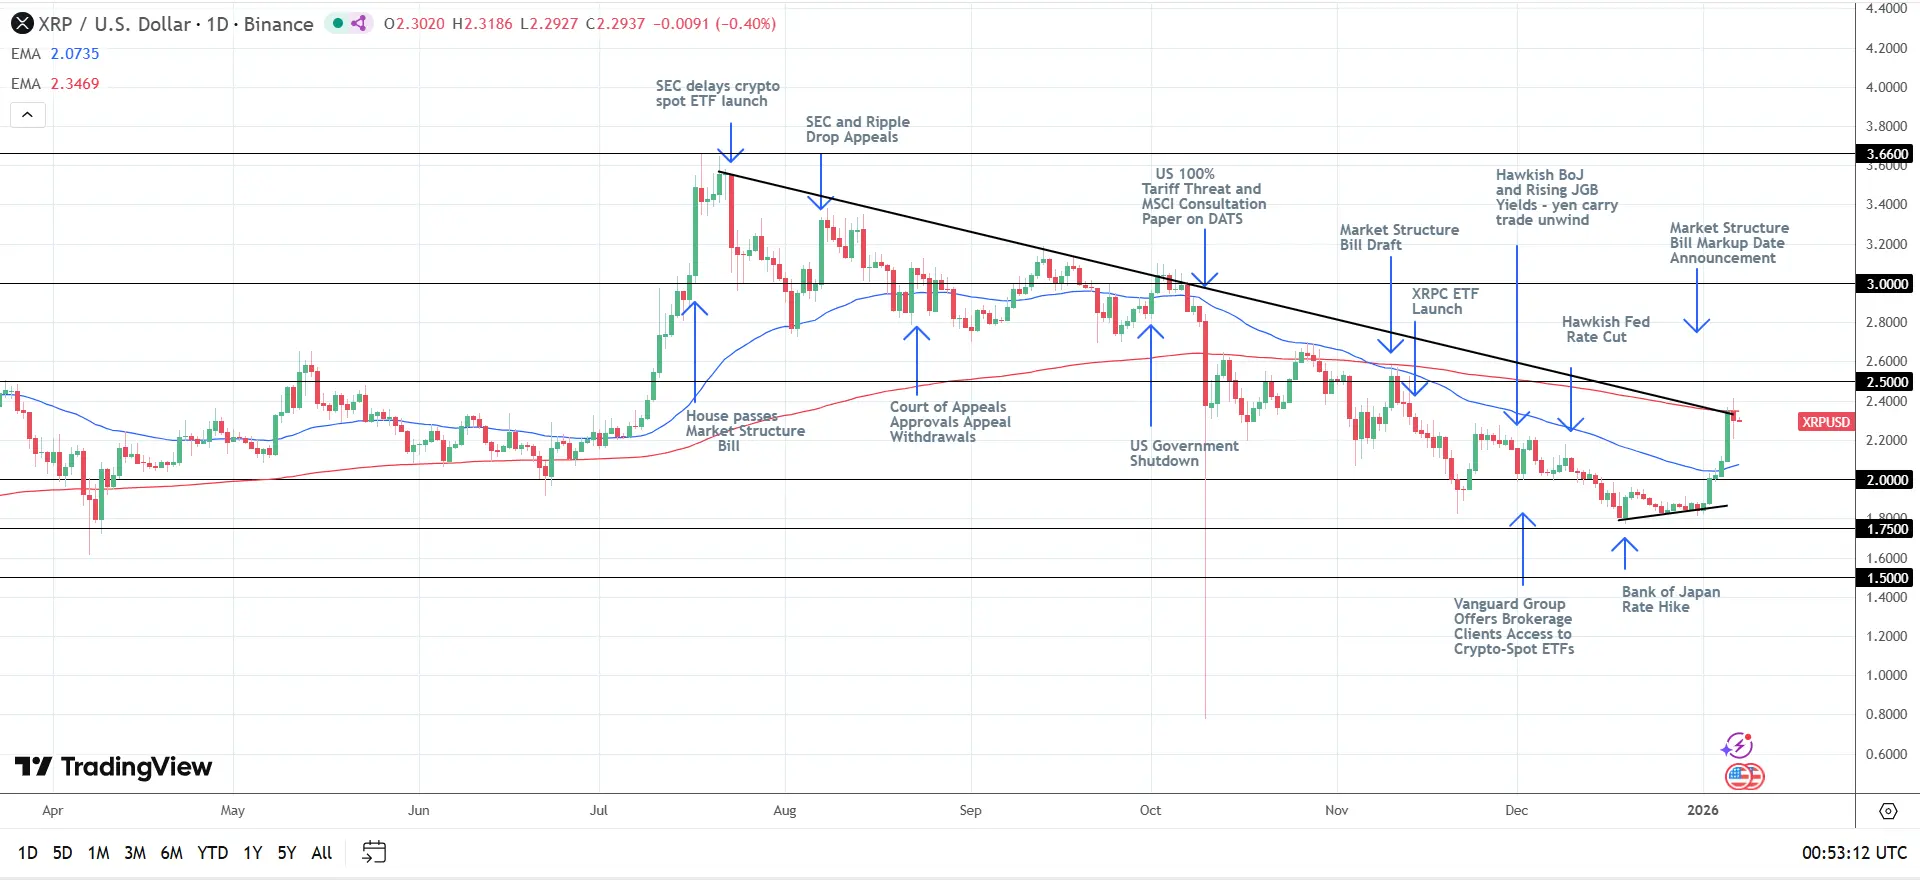
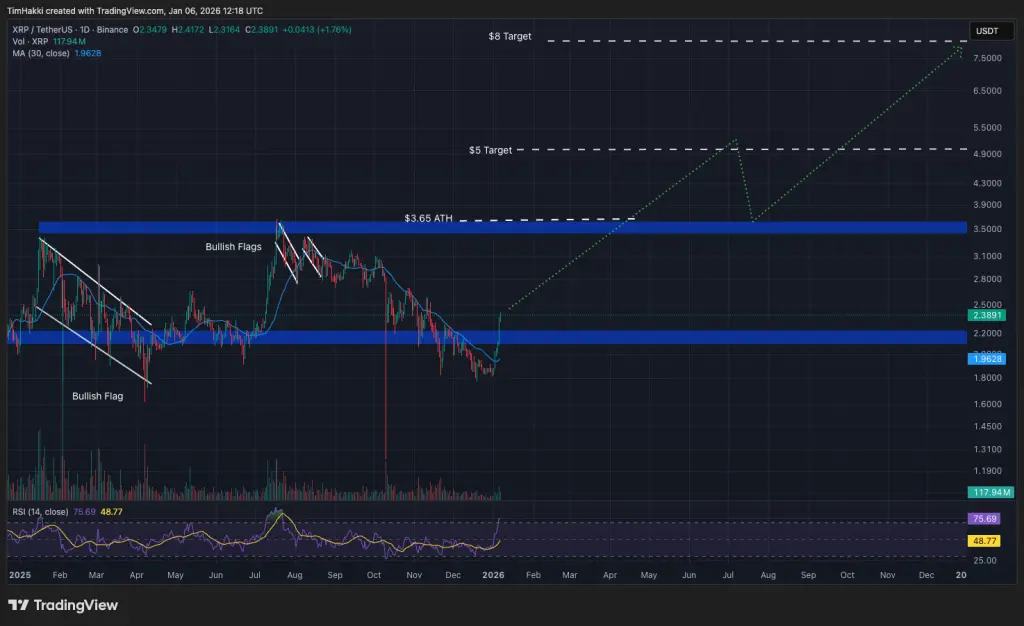
XRP Today's News: Market Structure Bill Vote Imminent! XRP Bullish Structure Remains Steady, Returning to $3 Could Be Just Around the Corner?
As the U.S. Senate Banking Committee is scheduled to review and vote on the key Digital Asset Market Structure Bill on January 15, 2026, the XRP market is holding its breath. Driven by optimistic expectations, XRP's price surged to $2.4154 on January 6, reaching a new high since November last year, followed by a slight correction due to profit-taking. Despite short-term volatility, XRP spot ETF continues to see strong capital inflows — with a net inflow of $1.25 billion since listing, far surpassing the Bitcoin ETF during the same period — along with positive fundamentals supporting a medium-term bullish outlook. Market attention is focused on upward targets of $3.0 and even $3.66.
MarketWhisper·17h ago
Solana 2025 Fully Explodes! Application Revenue Surges 46%, Multiple Indicators Hit Record Highs
Solana's application revenue in 2025 reached $2.39 billion, a 46% year-over-year increase, with 7 applications surpassing $100 million in revenue. Network revenue totaled $1.4 billion, a 48-fold increase over two years; stablecoin supply reached a record high of $14.8 billion; DEX trading volume hit $1.5 trillion, a 57% annual increase.
MarketWhisper·18h ago

XRP Today's News: January 15 Senate Vote Countdown, ETF Achieves Zero Outflows
XRP retraced to $2.3028 after five consecutive days of gains, hitting an 11-month high of $2.4154. The Senate will review the Market Structure Bill on January 15, and XRP has surged 33% on the news. ETF total inflows reached $1.25 billion with zero outflows. It broke below the 200-day moving average but remains above the 50-day moving average. The medium-term target is $3.0, and the long-term target is $3.66.
MarketWhisper·18h ago
Giant players enter the scene: Morgan Stanley officially applies for Bitcoin and Solana spot ETFs
Global financial giant Morgan Stanley has submitted documents to the US SEC to apply for spot Bitcoin and Solana ETFs. This not only marks the bank managing trillions of dollars in assets officially entering the cryptocurrency fund space but also could inject new vitality into the traditional financial markets. If approved, these products will provide qualified investors with a regulated direct investment channel in digital assets, further promoting the integration of cryptocurrencies into mainstream investment portfolios. This application comes at a time when the US spot cryptocurrency ETF market assets under management have surpassed $150 billion, indicating sustained strong institutional demand.
MarketWhisper·18h ago
China's mysterious Kimi AI predicts! XRP, SOL, Dogecoin 2026 surge list
China's Kimi AI releases 2026 forecast: XRP will reach $8, SOL will break through $400, and Dogecoin will reach $0.45. The forecast is based on catalysts such as ETF launches, institutional adoption, and technological breakthroughs.
MarketWhisper·18h ago
Gate Daily (January 7): The US transfers over 225 million USDT; MSCI list decision temporarily does not exclude MicroStrategy
Bitcoin (BTC) initially declined then rebounded, currently around $92,770 as of January 7. The US government moved out over 225 million USDT, raising concerns. MSCI has decided not to remove MicroStrategy and digital asset funds from the index list for now. According to Bloomberg, the chat platform Discord has secretly submitted an IPO application to the U.S. Securities and Exchange Commission.
MarketWhisper·19h ago
Morgan Stanley applies for dual ETFs! Bitcoin and Solana predicted to attract 150 billion annually
Morgan Stanley applies to the SEC for Bitcoin and Solana ETFs, with SOL featuring staking functionality. On Monday, Bitcoin ETF net inflows reached a record high of $697 million, and Bloomberg analysts forecast annual inflows of $150 billion. Morgan Stanley only opened recommendations for crypto ETFs in October last year, and now it is issuing its own with a BYOA strategy.
MarketWhisper·19h ago

[Gift Master PICK] SOL USD Margin Longs Account for 72%... BTC and ETH Also Show a Rebound Trend
■ Major Cryptocurrency Long Positions Status
Based on position volume, Bitcoin(BTC) long positions account for 69.23%( of USD margin, a+1.42%p) increase from the previous day, and 62.85%( of coin margin, a-0.15%p) decrease.
Ethereum(ETH) recorded 71.04%( of USD margin, a+1.30%p) increase, and 68.99%( of coin margin, a+0.09%p) increase. XRP shows 61.92%( of USD margin, a+0.79%p) increase, and 43.95%( of coin margin, a-0.56%p) decrease.
Solana(SOL) statistics show 71.96%( of USD margin, a+3.47%p) increase, and 76.68%( of coin margin, a-1.99%p) decrease. Dogecoin(DOGE) recorded 70.69%( of USD margin, a-2.03%p) decrease, and 45.26%( of coin margin, a-1.31%p) decrease.
■ Long Position Accounts
TechubNews·20h ago
Morgan Stanley Files Bitcoin and Solana ETFs Marking Crypto Shift
_Morgan Stanley files for Bitcoin and Solana ETFs, marking a significant shift toward institutional crypto adoption and investor demand._
Morgan Stanley’s recent filings for Bitcoin and Solana exchange-traded funds (ETFs) signal a major shift in the finance industry.
The bank submitted the
LiveBTCNews·20h ago
Morgan Stanley Expands Crypto Offerings with Bitcoin and Solana ETF Filings
Morgan Stanley has filed for Bitcoin and Solana ETFs, providing institutional investors with direct exposure to these cryptocurrencies. The filings aim to enhance crypto offerings and position the firm alongside other major asset managers in the competitive ETF market.
CryptoBreaking·01-06 18:25
Morgan Stanley Registers Bitcoin and Solana Funds With SEC
Morgan Stanley has filed for spot Bitcoin and Solana ETFs, awaiting regulatory approval. These passive funds aim to track the performance of their respective cryptocurrencies but have not yet disclosed custodians or fees. Bitcoin ETFs currently hold $119 billion in assets, while Solana ETFs are a newer investment option.
Decrypt·01-06 15:41
Jupiter Rolls Out JupUSD as Capital-Efficient Stablecoin for Solana Ecosystem Backed by BlackRock’s BUIDL Fund
Upon launching the JupUSD stablecoin, Jupiter said that 90% of its reserves are held in USDtb, a licensed, GENIUS-compliant stablecoin backed by BlackRock’s BUIDL fund.
JupUSD is integrated across the DEX’s ecosystem, thereby making it a unified stablecoin settlement layer on the platform.
S
CryptoNewsFlash·01-06 14:25
Solana (SOL) price heads towards higher levels thanks to accelerated ETF inflows
The price of Solana (SOL) continues to extend its upward momentum and surpasses the $137 mark at the time of writing on Tuesday, up more than 7% in the previous week. Institutional demand for SOL remains strong as spot ETF funds recorded a net inflow of over $16 million on Monday, marking a significant inflow tr
SOL-2,32%
TapChiBitcoin·01-06 13:10
Solana Price Analysis for Jan 6: Can SOL Break Through These Crucial Resistance Levels?
Solana (SOL) is experiencing strong bullish momentum, recently reclaiming the critical $130 level with an 11.1% weekly gain. Technical indicators suggest potential resistance at $139.58 and $144. Increased development activity further bolsters long-term confidence in the project.
TheCryptoBasic·01-06 11:41
BREAKING: Banking Behemoth Morgan Stanley Files for Solana and Bitcoin ETFs - U.Today
Morgan Stanley has filed for a Solana ETF to track the performance of SOL, using third-party custodians and engaging in staking for rewards. Additionally, the firm has also applied for a Bitcoin ETF, joining several other issuers.
UToday·01-06 11:30
XRP and SOL surpass BTC and ETH in the preferred holdings of institutional investors in 2025
For many years, the strategy of organizations with crypto was quite simple: buy Bitcoin, possibly allocate a small portion to Ethereum, and ignore the rest of the market.
By 2025, that pattern has been rewritten.
Although Bitcoin still maintains the position as the largest asset in terms of total market size, the core story of the year
TapChiBitcoin·01-06 11:10
Rotating capital eyes altcoins from Solana to Sui in early cycle shift
Early market rotation sends attention from majors to altcoins like Solana spanning L1s, privacy tokens, and new narratives like APEMARS, Sui, Hyperliquid, and Hedera.
Summary
Market enters an early rotation phase as attention shifts from Bitcoin and Ethereum toward a basket of altcoins across i
Cryptonews·01-06 09:18

Gate Research Institute: Solana ETF Achieves Largest Single-Day Net Inflow | Giza's AI Agent Asset Management Scale Exceeds $40 Million
Cryptocurrency Market Overview
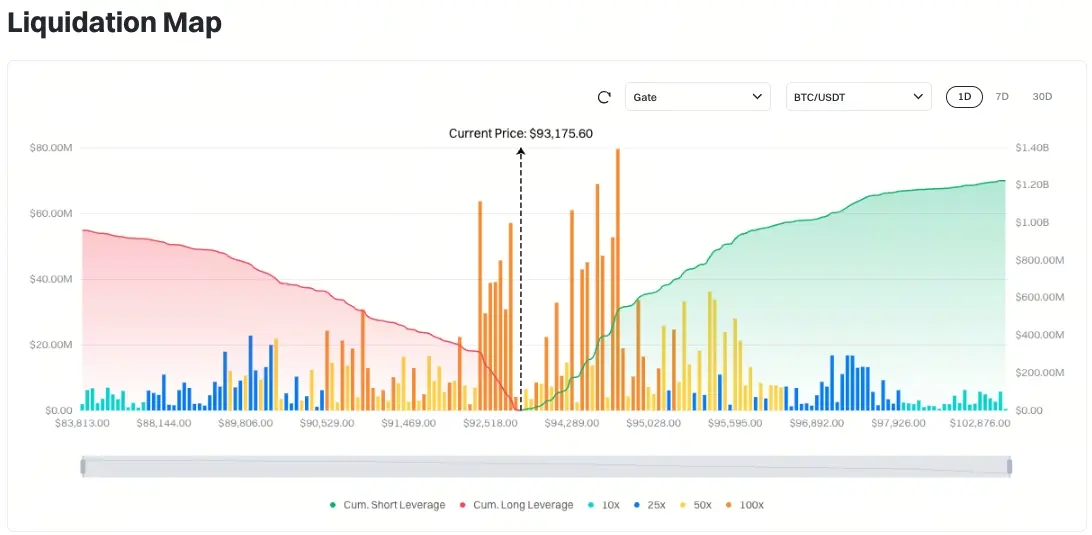
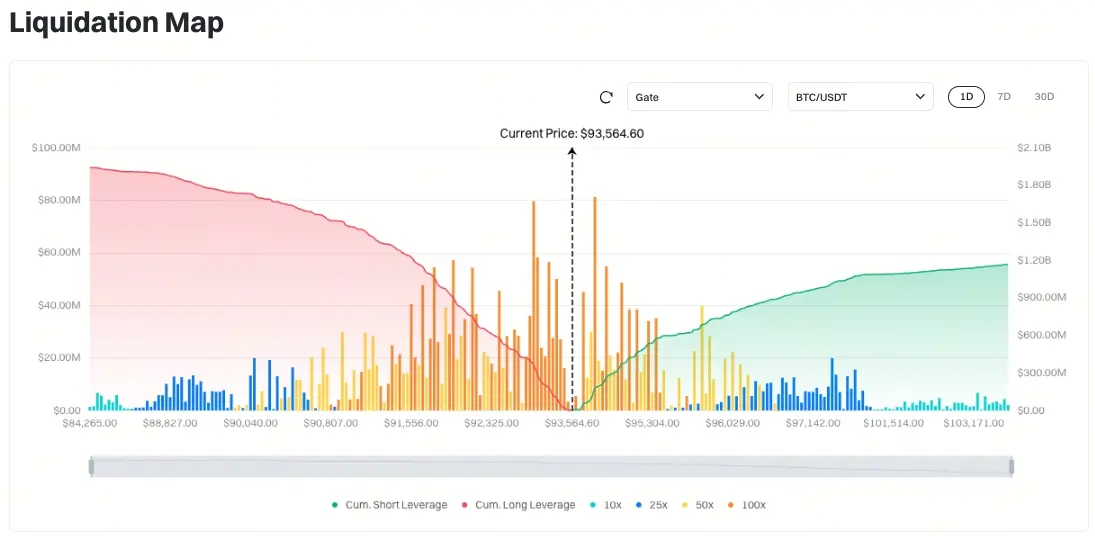
BTC (+1.17% | Current price 93,921 USDT): The daily chart shows that Bitcoin has broken above the medium- to long-term downtrend channel. The MACD green bars continue to rise, and the RSI is moving higher, releasing a somewhat positive technical signal, indicating that the price still has room for further upward movement. Currently, BTC is testing the resistance at around $93,400, a level that coincides closely with a previous high-volume trading zone. If this resistance is broken effectively, it could open the way to test the $100,000 mark. The liquidation heatmap indicates that recent major liquidation clusters are concentrated below the current price, especially in the $85,000–87,000 range, suggesting that leveraged long positions are relatively concentrated. In contrast, liquidity above is more dispersed, implying that before the market continues to rise, some time is still needed for momentum to build. The recent slow upward movement has already cleared some short
GateResearch·01-06 08:05
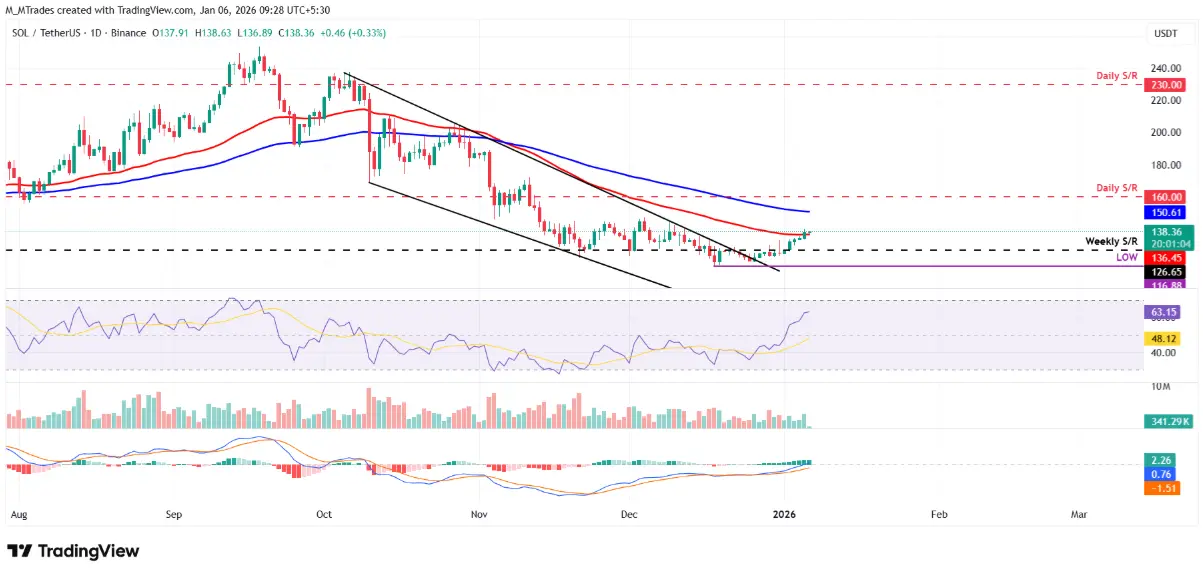
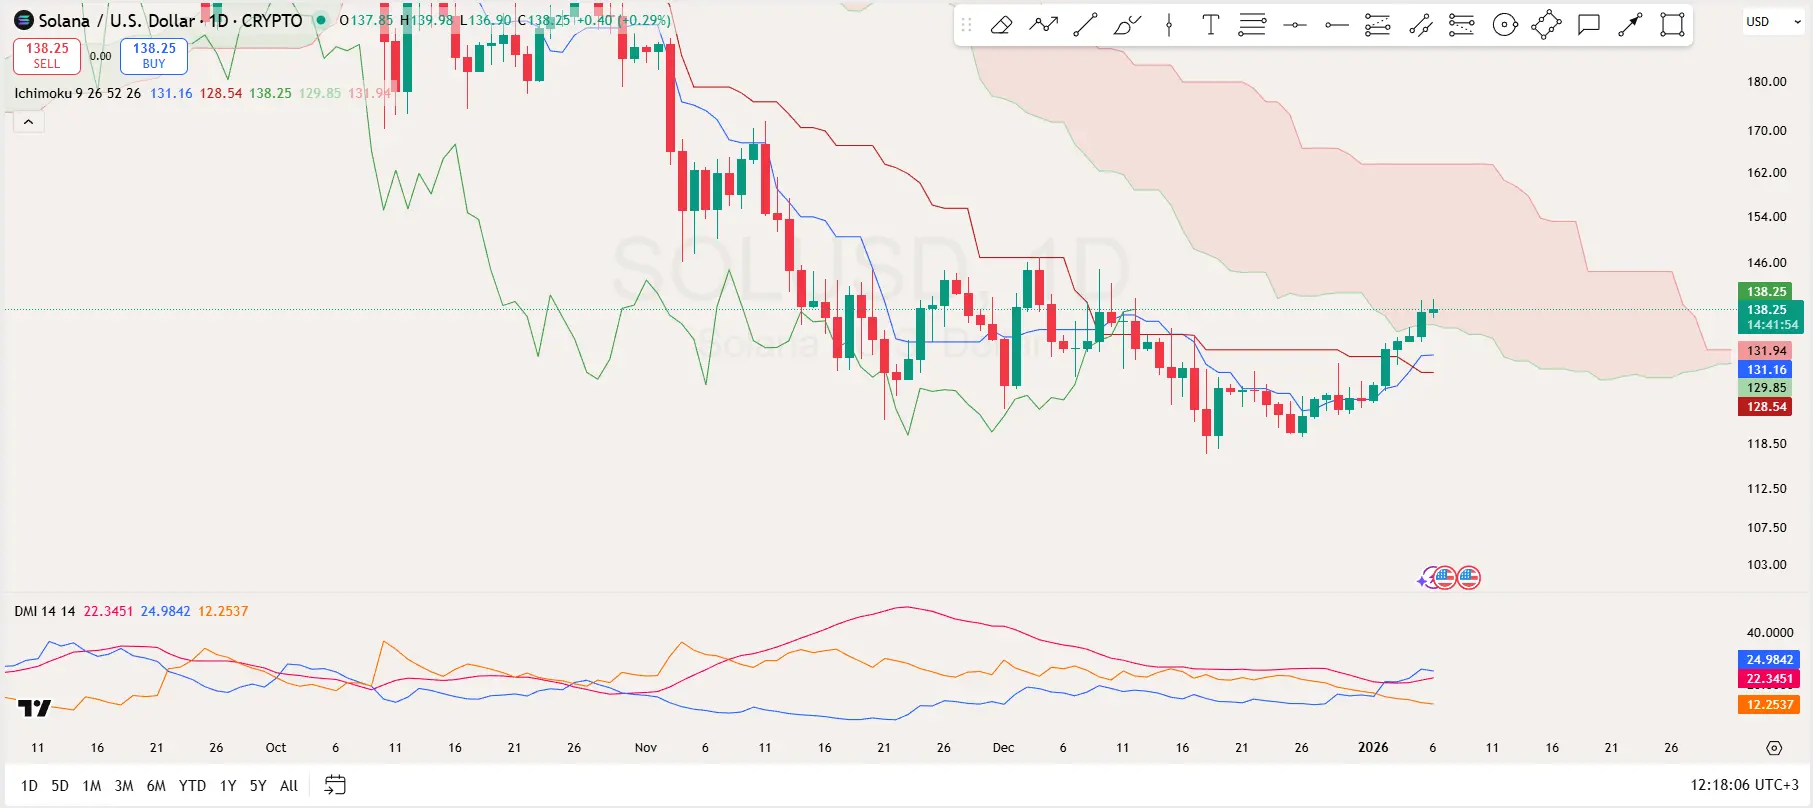
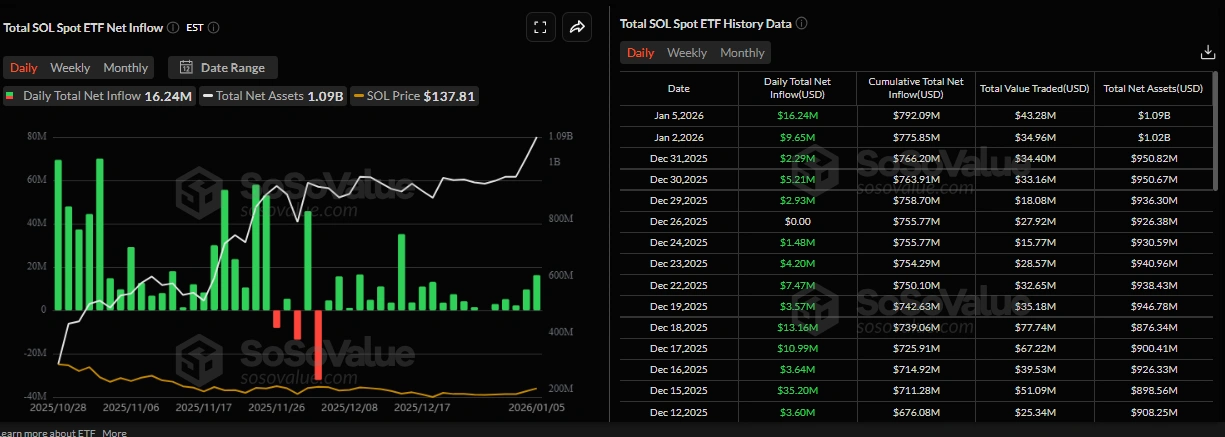
Solana Today's News: Spot ETF demand surges, SOL price breaks $137
As of January 6, Solana broke through $137, gaining 7% for the week. Spot ETF inflows on Monday reached $16.24 million, a new high since mid-December, with total net assets surpassing $1 billion. Stablecoin supply rebounded to $15.32 billion, with a clear buyer-dominated trend. Technically, it broke out of the wedge pattern and stabilized above the 50-day EMA, with RSI rising to 63, targeting $150.61.
MarketWhisper·01-06 05:43
[Spot ETF] XRP inflow of $46.1 million · SOL inflow of $16.24 million
In the US major altcoin spot ETF market, capital inflows centered around XRP and Solana continue, with the temperature difference between assets becoming increasingly apparent.
According to SosoValue statistics, as of January 5 (local time), the US XRP spot ETF market experienced a total of $46.1 million in single-day net inflows.
Since January 29, it has maintained inflows for five consecutive trading days, with the total net inflow expanding to $1.23 billion.
▲Bitwise XRP ($16.61 million) ▲Franklin XRPZ ($12.59 million) ▲Grayscale XRP ($9.89 million) ▲21Shares XRP ($7.01 million) — these four products confirmed net inflows, while the remaining one showed no capital flow changes.
The total trading volume is $72.15 million, and the total net asset value of XRP spot ETFs is 16
TechubNews·01-06 05:06
DeFi Development purchased an additional 25,000 SOL, increasing the total portfolio to 2.22 million coins
DeFi Development Corp. (DFDV), a DeFi development company listed on the Nasdaq, has significantly increased its Solana holdings by purchasing an additional 25,000+ SOL, bringing the total portfolio to approximately 2.22 million SOL as of January 1, 2026. This move demonstrates the company's strong confidence in the long-term potential.
SOL-2,32%
TapChiBitcoin·01-06 02:08
Gate Daily (January 6): US banks recommend Bitcoin ETFs to wealth management clients; Japan commits to supporting cryptocurrencies being listed on stock exchanges
Bitcoin (BTC) continues its rebound trend, currently around $93,860 as of January 6. US banks are allowing financial advisors to recommend that clients allocate 1-4% of their investment portfolios to Bitcoin ETFs. Japanese Finance Minister Shigemitsu Katayama has pledged full support for cryptocurrencies to be listed on stock exchanges. Polymarket will launch a real estate prediction market through a partnership with Parcl.
MarketWhisper·01-06 01:16
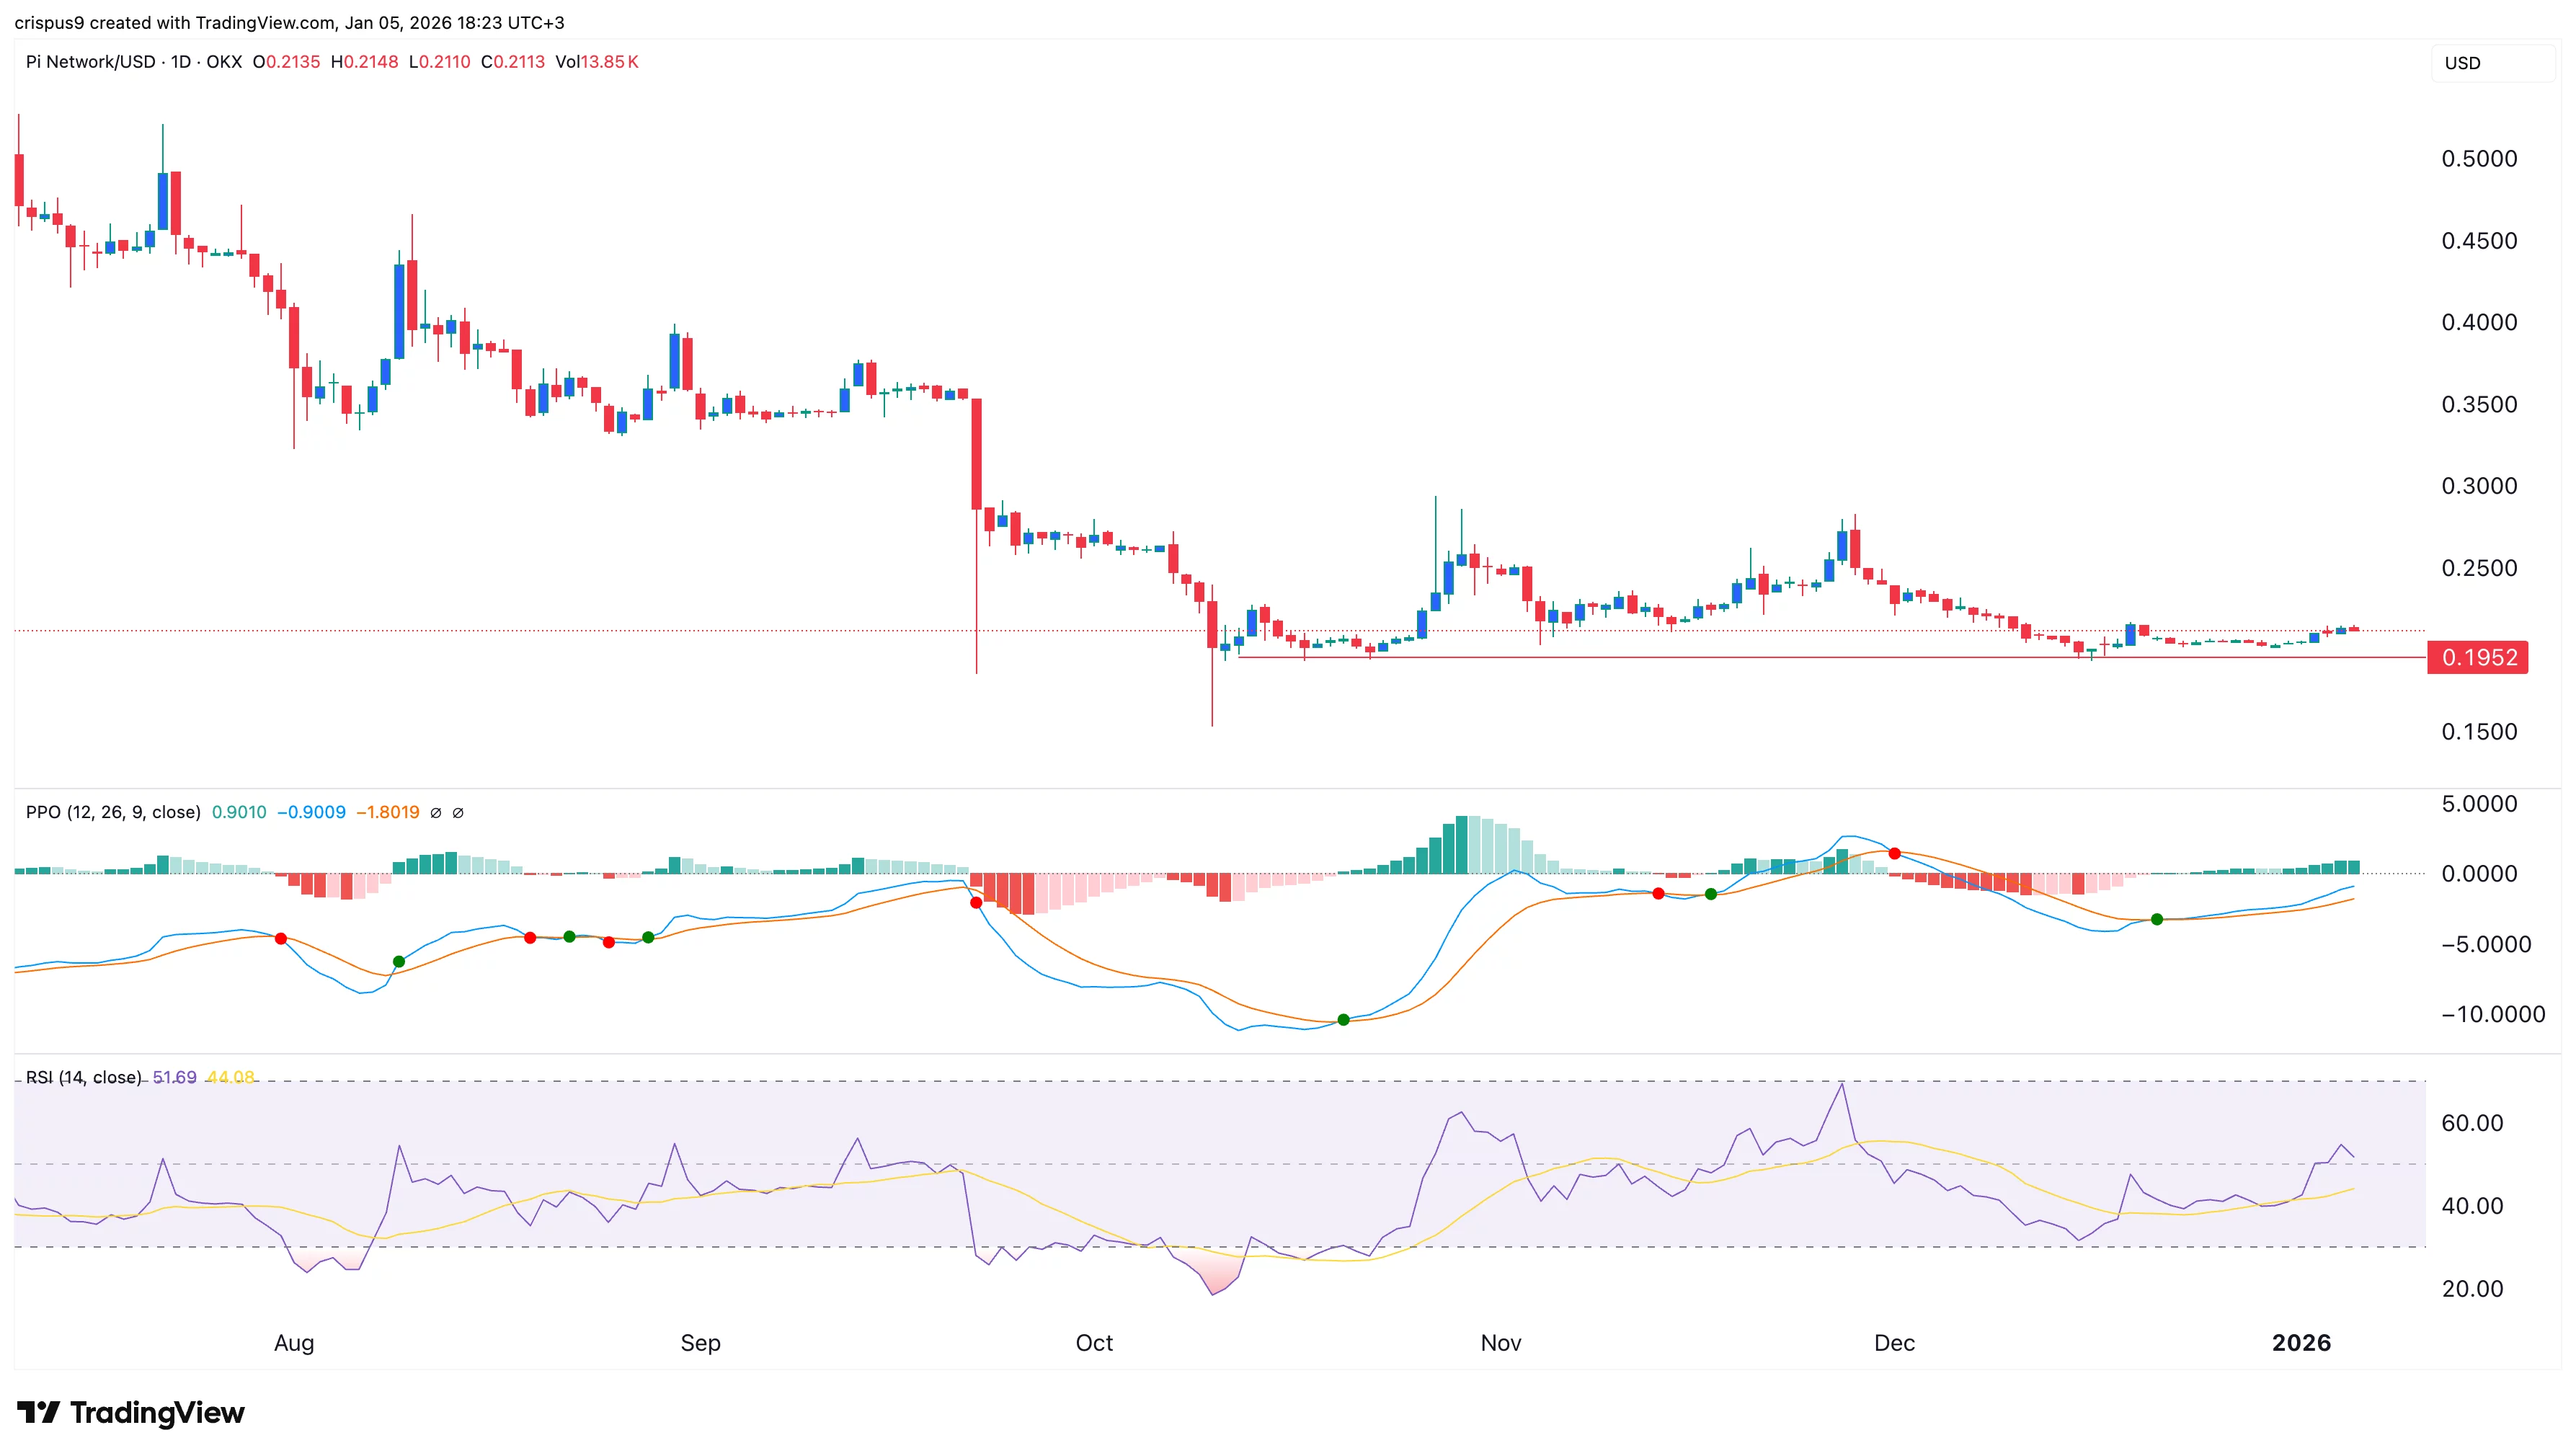
Pi Network's daily trading volume is only 16 million! Double bottom pattern hints at a rebound to $0.25
Pi Network hovered around $0.2115 on Monday, slightly above the key support level of $0.1952, more than 90% below its all-time high. The daily trading volume is only $16 million, available on only a few exchanges such as Gate. This month, 117 million tokens will be unlocked. Technical analysis shows a double bottom pattern with the neckline at $0.2823, accompanied by a bullish divergence, with a target of $0.25.
MarketWhisper·01-06 00:58
Zero Knowledge Proof Seals NRL Dolphins Deal As 100M UNI Burn Reshapes UNI Forecasts and Solana S...
As December wraps up, crypto sentiment remains uncertain. The Uniswap price prediction saw improvement following a 5% surge and a governance proposal to burn 100M UNI, while the Solana price prediction remains cautious despite Brazil gaining regulated institutional access. Both reflect growing
BlockChainReporter·01-05 17:04
Load More