Bitcoin traded at $70,795 on March 14, 2026, with a market capitalization of $1.41 trillion and 24-hour trading volume of $49.48 billion. The cryptocurrency moved within an intraday range between $70,416 and $73,838 while technical indicators across major timeframes reflected a neutral market structure.
Bitcoin Chart Outlook
On the daily chart, bitcoin continues to trade inside a consolidation range following a rejection near the $74,000 resistance zone. Current price levels around $70,467 on Bitstamp place the asset in the middle of a broader visible trading band between approximately $63,000 and $77,500.
Market structure reflects sideways movement with declining volatility after the rejection near recent highs. Key resistance remains between $73,800 and $74,000, while mid-range resistance sits near $71,200. Support is identified around $69,500, with stronger structural support near $66,000. As long as the price remains above the $69,500 level, the broader bias remains neutral to slightly upward within the existing range.
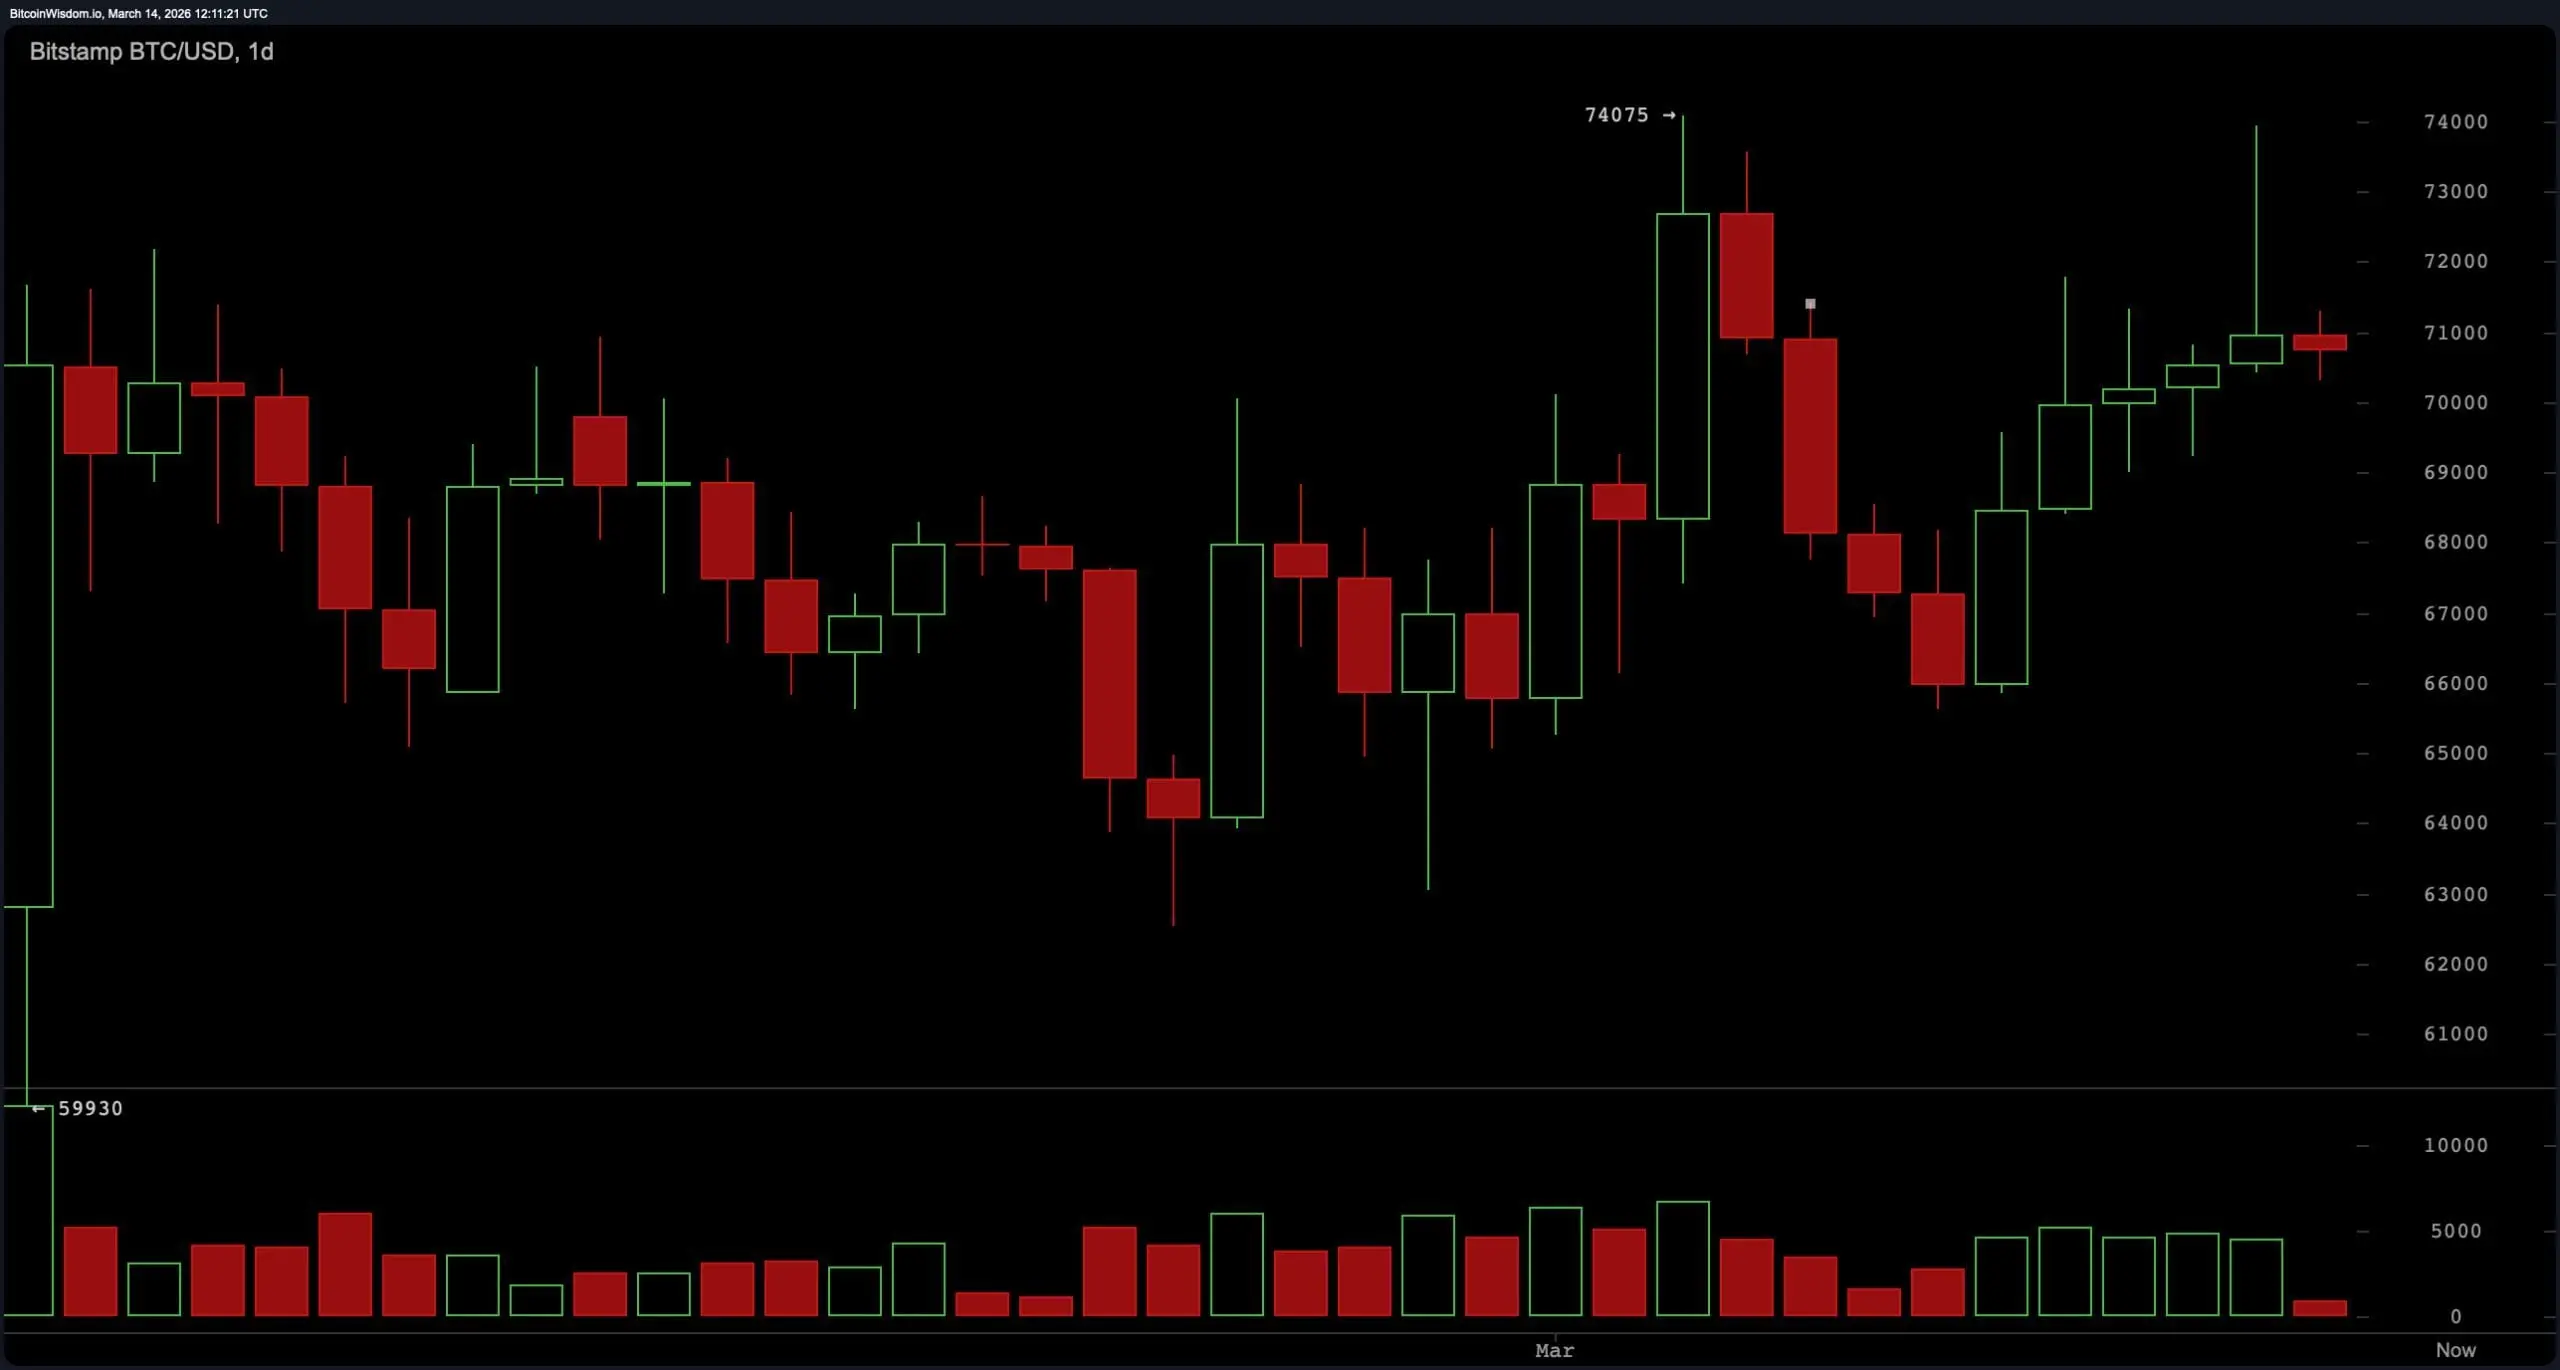 BTC/USD 1-day chart via Bitstamp on March 14, 2026.
The four-hour bitcoin chart shows continued sideways consolidation supported by a sequence of higher lows. Previous swing levels progressed from approximately $65,600 to $69,000 and then to near $70,000, suggesting gradual upward pressure beneath resistance. Price has repeatedly encountered resistance between $71,500 and $72,000, creating a compression pattern as volatility narrows. This type of price structure often precedes expansion once resistance or support is decisively breached. The current compression below resistance indicates that a move beyond this zone could determine the next directional move of roughly $3,000 to $5,000.
BTC/USD 1-day chart via Bitstamp on March 14, 2026.
The four-hour bitcoin chart shows continued sideways consolidation supported by a sequence of higher lows. Previous swing levels progressed from approximately $65,600 to $69,000 and then to near $70,000, suggesting gradual upward pressure beneath resistance. Price has repeatedly encountered resistance between $71,500 and $72,000, creating a compression pattern as volatility narrows. This type of price structure often precedes expansion once resistance or support is decisively breached. The current compression below resistance indicates that a move beyond this zone could determine the next directional move of roughly $3,000 to $5,000.
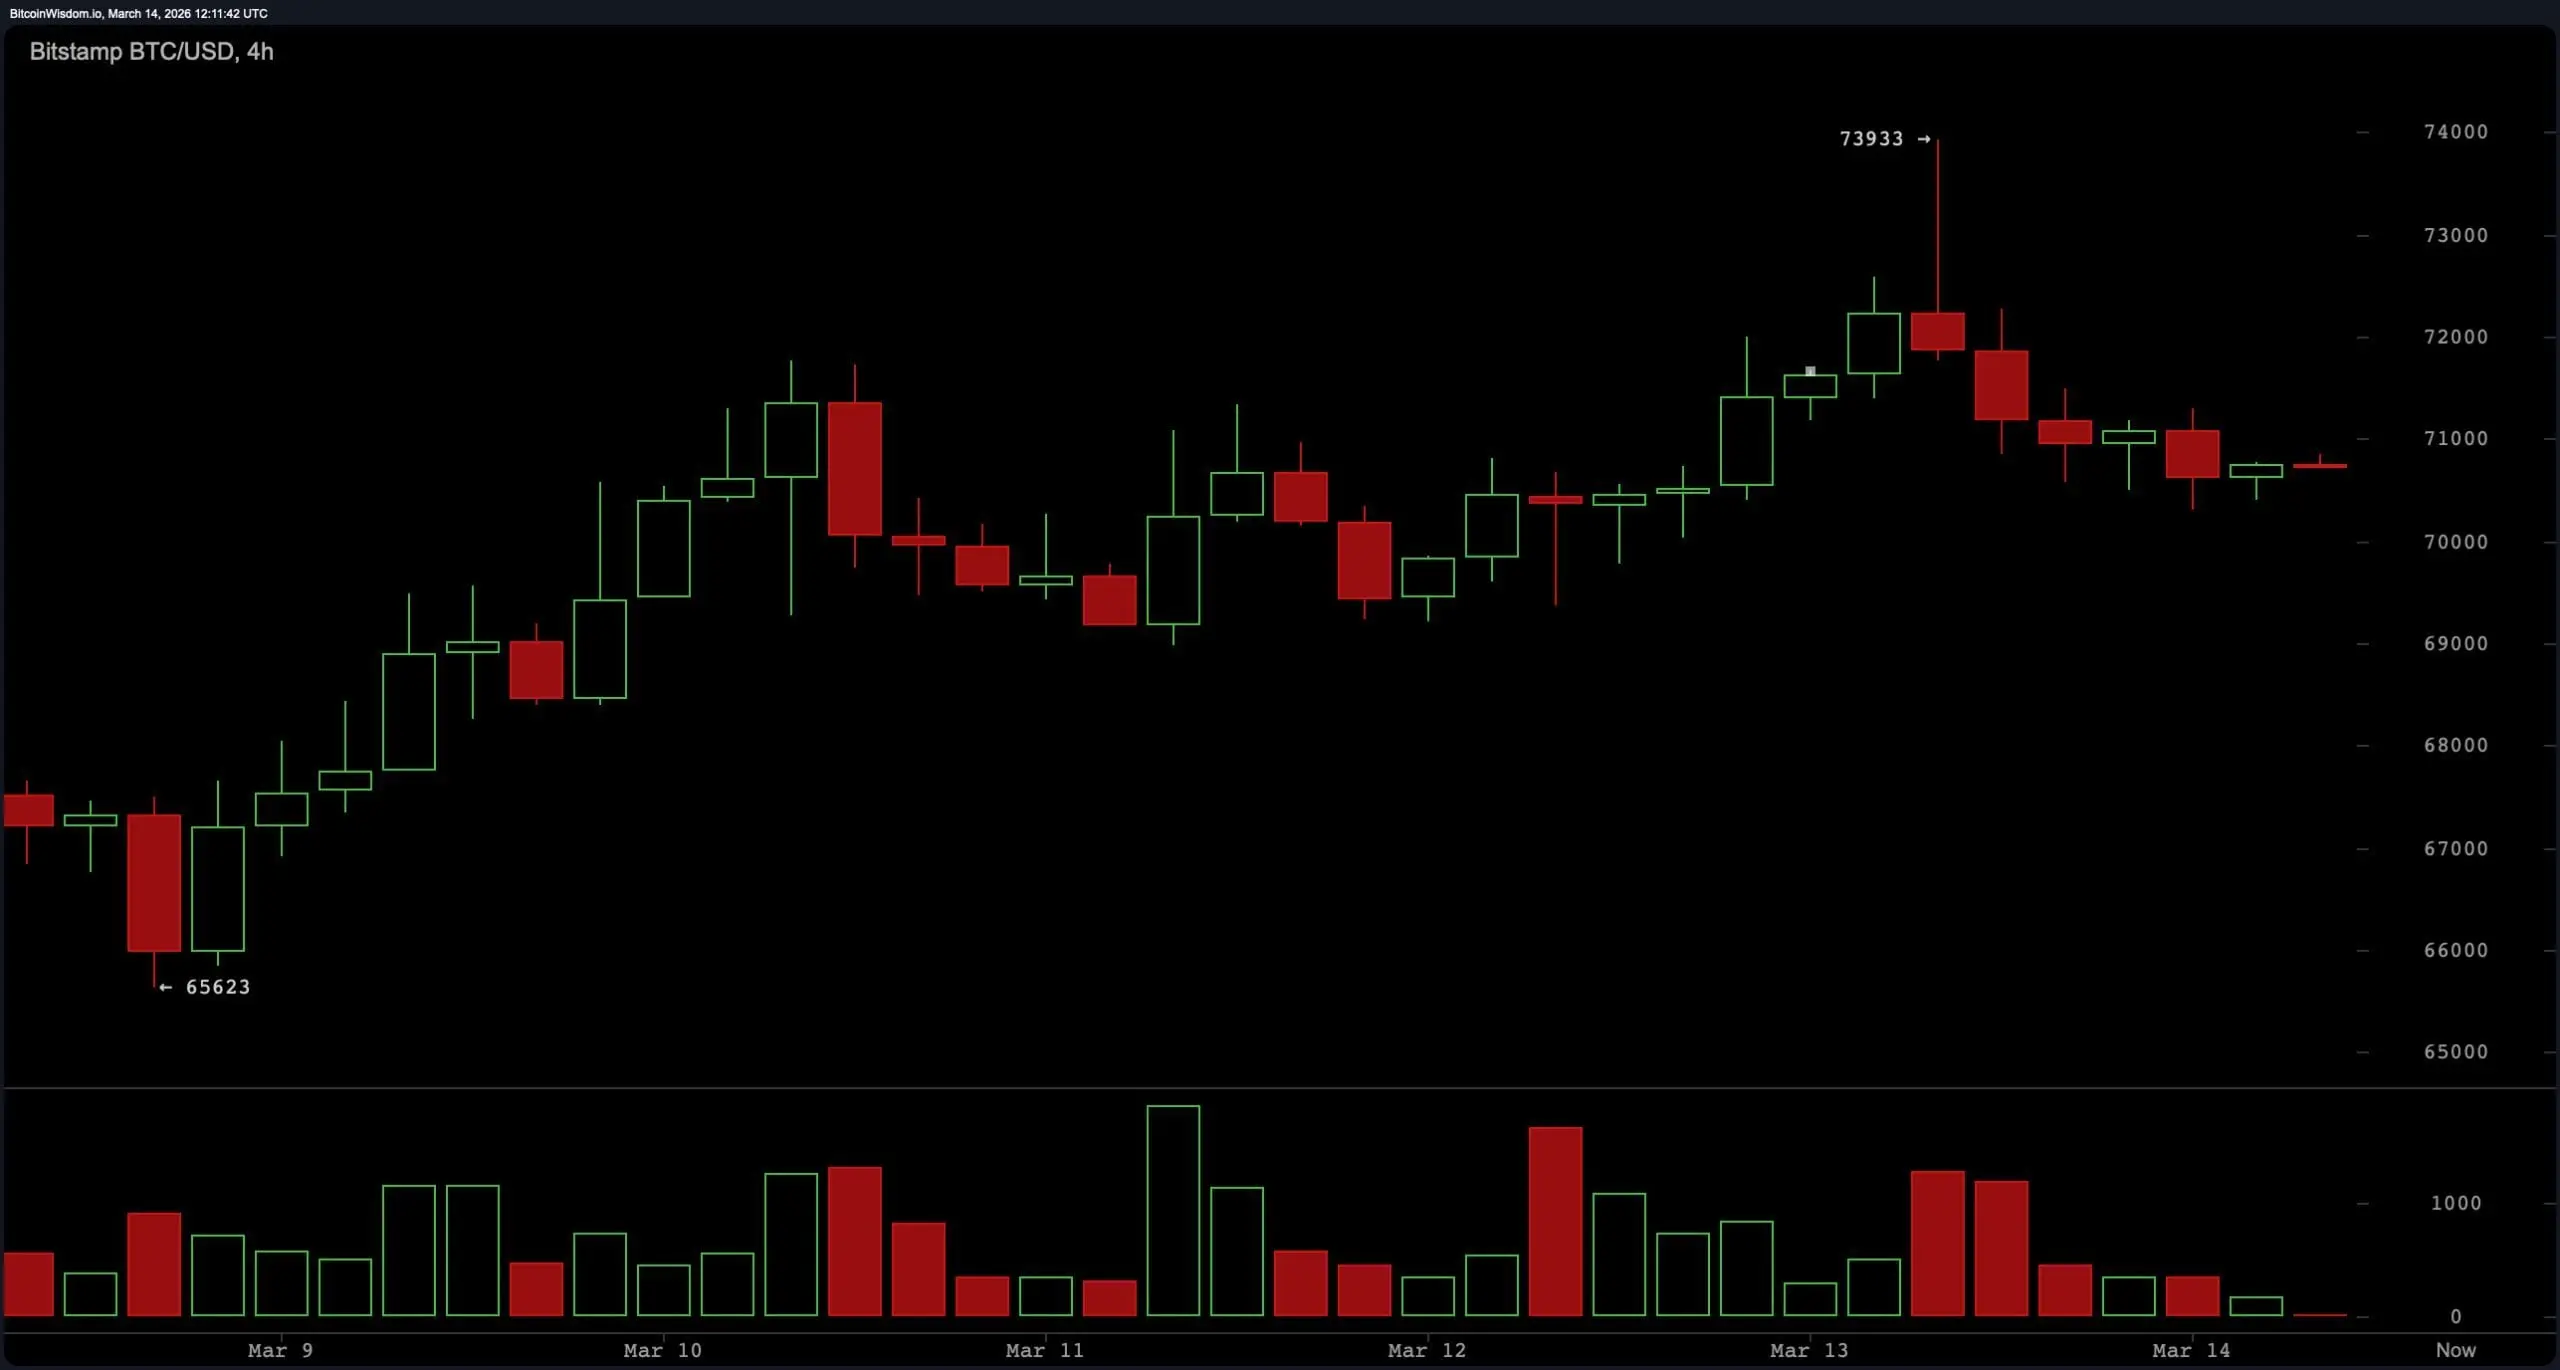 BTC/USD 4-hour chart via Bitstamp on March 14, 2026.
On the one-hour chart, bitcoin is trading within a tight intraday range between $70,300 support and approximately $71,100 resistance. Price movement has remained contained inside this narrow band while trading volume gradually declines, reflecting short-term equilibrium between buyers and sellers. Intraday consolidation within this range suggests the market is awaiting a catalyst for a breakout. Sustained movement above the $71,200 level would place the price near the upper resistance band around $72,800 and $74,000, while a breakdown below $69,500 would expose lower support areas near $67,800 and $66,000.
BTC/USD 4-hour chart via Bitstamp on March 14, 2026.
On the one-hour chart, bitcoin is trading within a tight intraday range between $70,300 support and approximately $71,100 resistance. Price movement has remained contained inside this narrow band while trading volume gradually declines, reflecting short-term equilibrium between buyers and sellers. Intraday consolidation within this range suggests the market is awaiting a catalyst for a breakout. Sustained movement above the $71,200 level would place the price near the upper resistance band around $72,800 and $74,000, while a breakdown below $69,500 would expose lower support areas near $67,800 and $66,000.
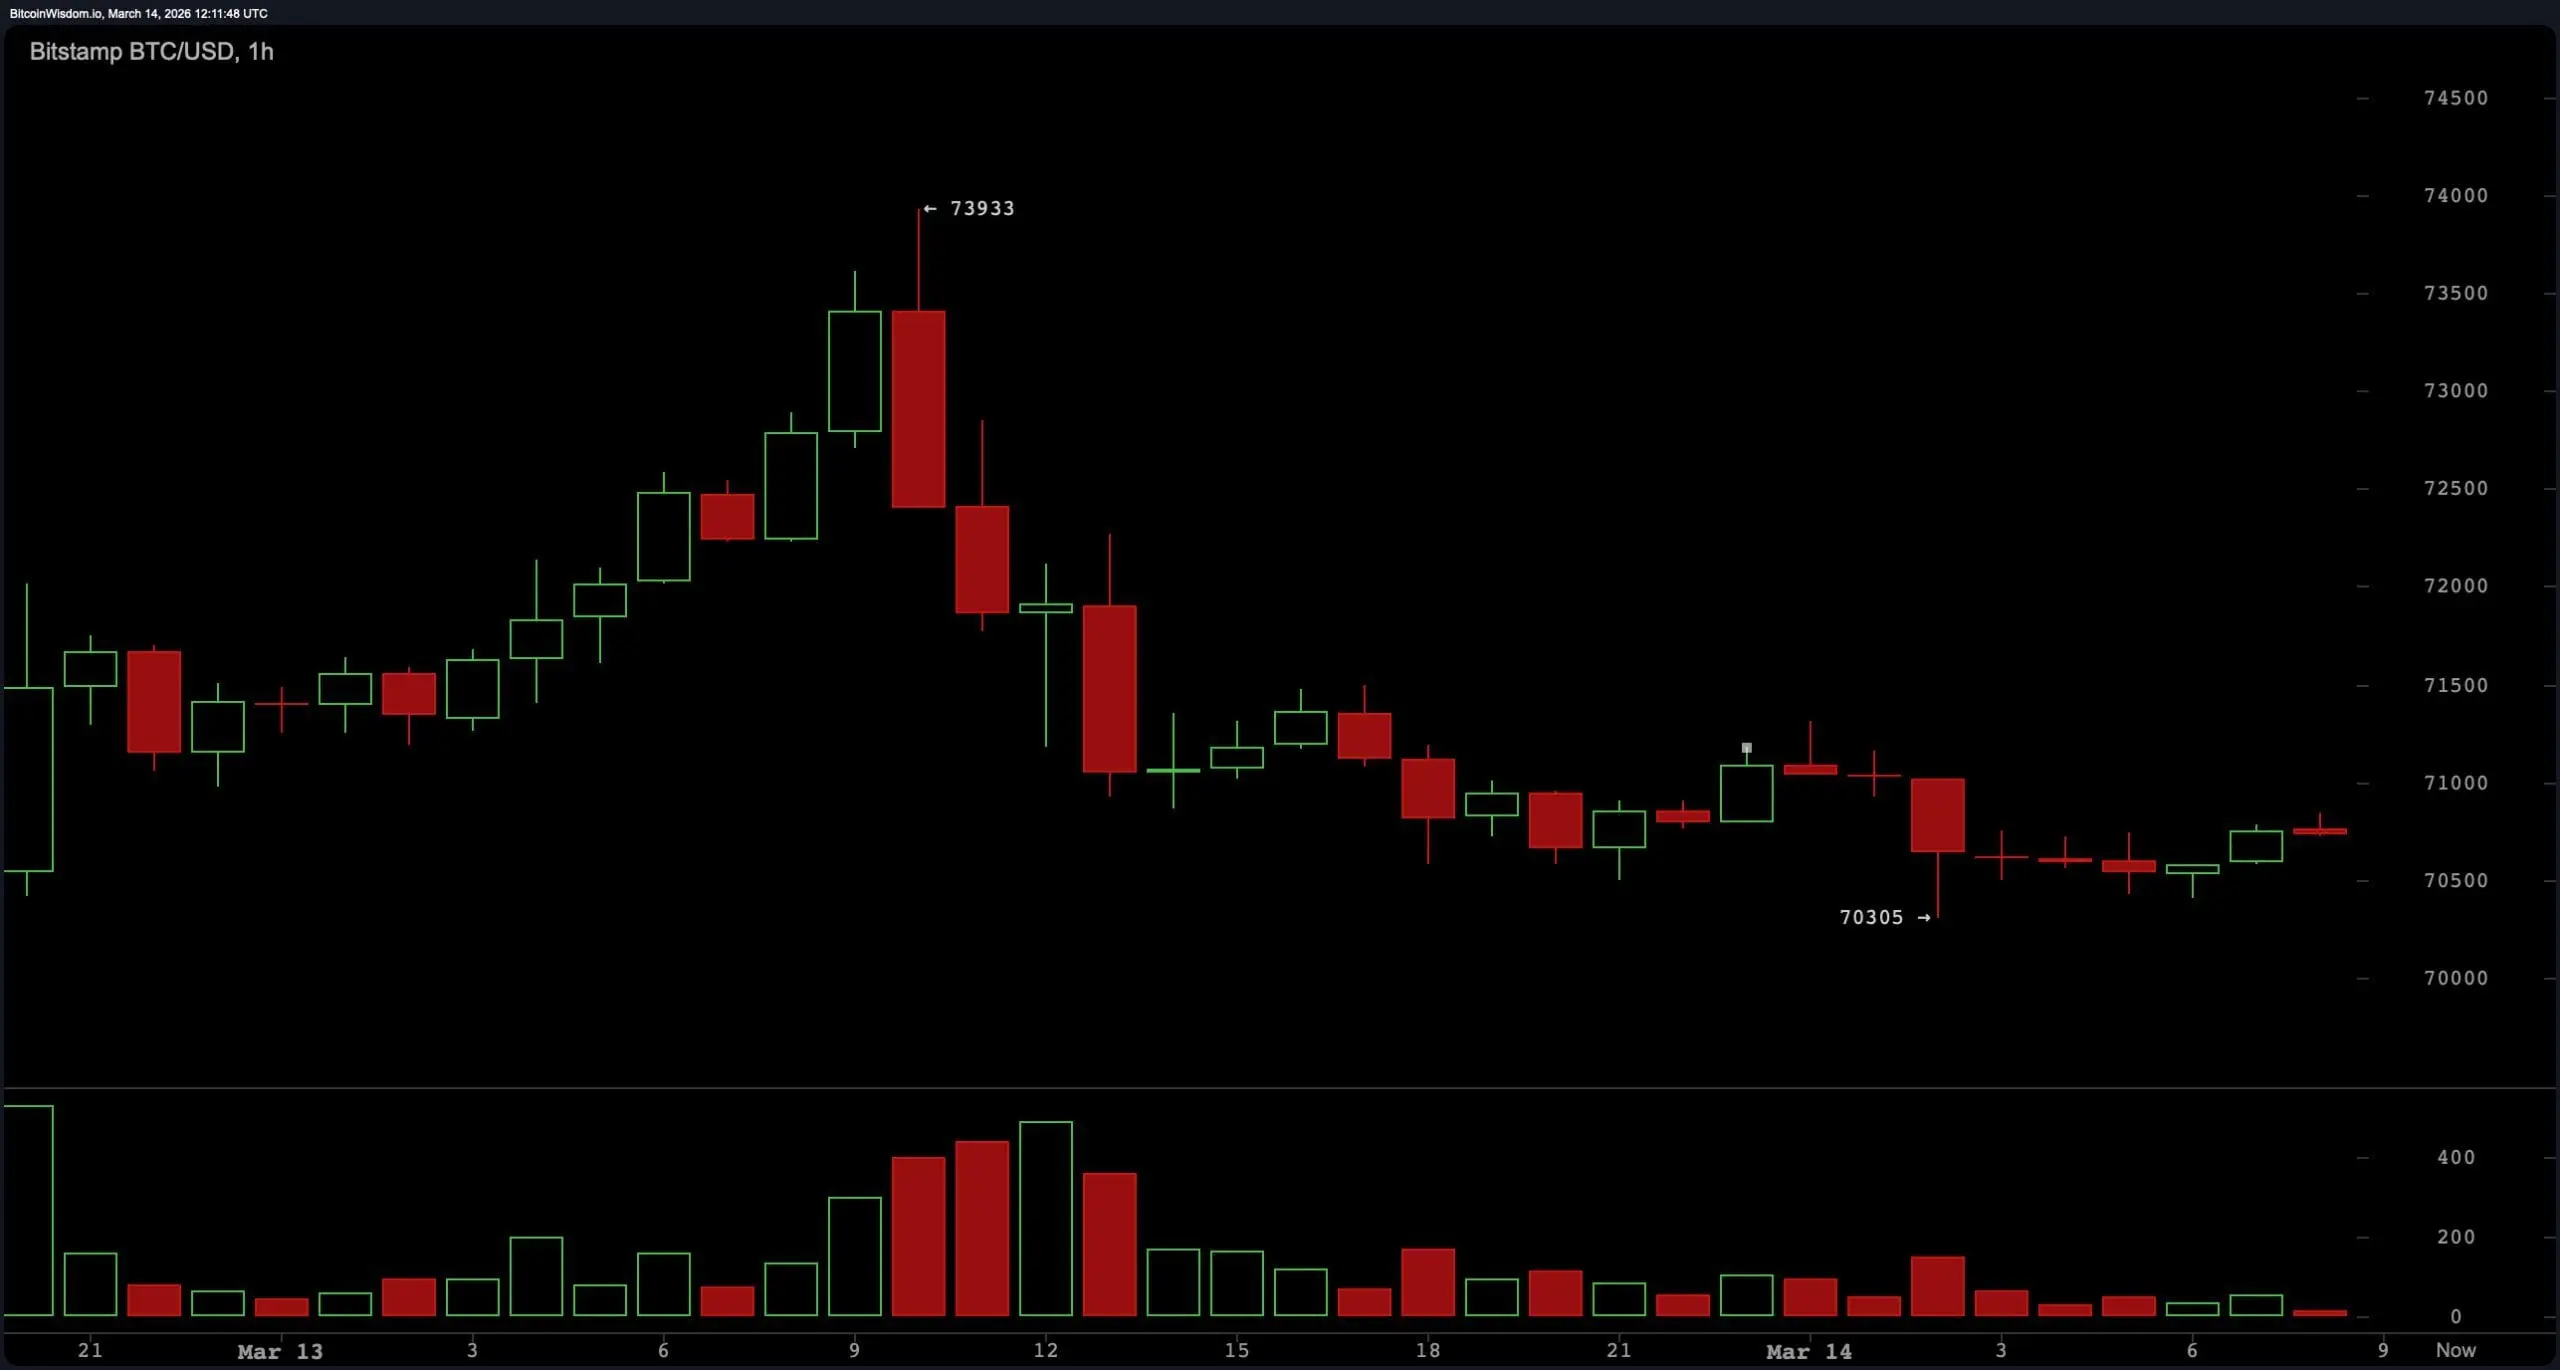 BTC/USD 1-hour chart via Bitstamp on March 14, 2026.
Oscillator readings reflect a neutral technical environment. The relative strength index ( RSI) is positioned at 53, indicating balanced momentum conditions. Stochastic reads 68, while the commodity channel index (CCI) is measured at 89, both also categorized as neutral signals.
BTC/USD 1-hour chart via Bitstamp on March 14, 2026.
Oscillator readings reflect a neutral technical environment. The relative strength index ( RSI) is positioned at 53, indicating balanced momentum conditions. Stochastic reads 68, while the commodity channel index (CCI) is measured at 89, both also categorized as neutral signals.
The average directional index (ADX) stands at 25, showing limited trend strength across the market. The Awesome oscillator records 2,432 and remains neutral. Momentum shows −1,891, signaling short-term downward pressure, while the moving average convergence divergence ( MACD) level registers −186 and signals upward momentum in the indicator summary.
Moving averages (MAs) present a split structure between short-term support and longer-term resistance levels. The exponential moving average (EMA) 10 sits at $69,648 and the simple moving average (SMA) 10 at $69,310, both signaling upward momentum relative to the current price. The EMA 20 at $69,305 and SMA 20 at $68,287 also remain supportive of the current range, along with the EMA 30 at $70,053 and SMA 30 at $68,215.
Longer-term averages reflect downward pressure, with the EMA 50 at $72,764 and the SMA 50 at $71,703 positioned above the price. Higher-period averages remain significantly elevated, including the EMA 100 at $79,665, SMA 100 at $80,935, EMA 200 at $87,978, and SMA 200 at $94,125. This distribution results in an overall neutral technical summary as short-term averages support current levels while longer-term averages remain above the market.
Bull Verdict:
If bitcoin maintains support above $69,500 and breaks decisively above the $71,200 resistance level, the current compression pattern could resolve to the upside. A sustained move through this level would clear short-term resistance and open the path toward $72,800 and a potential retest of the $73,800–$74,000 resistance zone seen on the daily chart. The sequence of higher lows on the four-hour timeframe and supportive short-term moving averages suggests underlying strength remains intact as long as price holds above the mid-range support area.
Bear Verdict:
A breakdown below the $69,500 support level would weaken the current consolidation structure and shift short-term momentum downward. Losing this level would place bitcoin below key range support and expose lower targets around $67,800, with a deeper support zone near $66,000 visible on the daily timeframe. Longer-term moving averages remaining above current price levels continue to signal overhead resistance, meaning sustained weakness below support could accelerate downside pressure if bearish momentum increases.
FAQ 🧭
- What is the bitcoin price on March 14, 2026?
Bitcoin is trading around $70,795, consolidating near the $70,000 level after rejecting resistance near $74,000.
- What are the key bitcoin resistance levels right now?
The main resistance levels for bitcoin are $71,200 in the short term and the major resistance zone between $73,800 and $74,000.
- What are the key bitcoin support levels to watch?
Key bitcoin support sits near $70,300 intraday, with stronger structural support at $69,500 and major support near $66,000.
- Is bitcoin trending up or down right now?
Bitcoin’s current technical trend is neutral as indicators and moving averages show consolidation between roughly $69,500 and $72,000.
Застереження: Інформація на цій сторінці може походити від третіх осіб і не відображає погляди або думки Gate. Вміст, що відображається на цій сторінці, є лише довідковим і не є фінансовою, інвестиційною або юридичною порадою. Gate не гарантує точність або повноту інформації і не несе відповідальності за будь-які збитки, що виникли в результаті використання цієї інформації. Інвестиції у віртуальні активи пов'язані з високим ризиком і піддаються значній ціновій волатильності. Ви можете втратити весь вкладений капітал. Будь ласка, повністю усвідомлюйте відповідні ризики та приймайте обережні рішення, виходячи з вашого фінансового становища та толерантності до ризику. Для отримання детальної інформації, будь ласка, зверніться до
Застереження.
Пов'язані статті
Молодий інвестор Гонконгу втратив $160M BTC, крадіжку нібито здійснив сожитель
Гонконгський інвестор втратив $160 млн у Bitcoin через крадіжку, здійснену його партнером, який мешкав з ним і мав доступ до їхніх цифрових активів, що підкреслює ризики безпеки при обміні приватними ключами.
GateNews11хв. тому
Адреса в блокчейні отримала прибуток 1,75 мільйона доларів на BTC та ETH, а потім відкрила довгу позицію на 39,4 мільйона доларів
20 березня адреса 0x94d закрила короткі позиції на суму 105 млн доларів США BTC та ETH, отримавши прибуток близько 1,75 млн доларів США, а потім відкрила довгі позиції, поточний розмір довгих позицій досягнув 39,4 млн доларів США з плаваючим збитком близько 10 тисяч доларів США. Ця адреса славиться зворотними операціями та майстерністю у волатильній торгівлі.
GateNews19хв. тому
Іран завдав удару по катарському СПГ, що спричинило втрати в розмірі $20 мільярдів доларів на рік, Bitcoin впав нижче $70K
Корпус стражів ісламської революції Ірану (IRGC) провів ракетні удари по промислового міста Рас-Латан в Катарі 18-19 березня 2026 року, він завдав серйозної шкоди двом потокам виробництва зрідженого природного газу, які представляли 12,8 мільйонів тонн на рік (MTPA) потужності—приблизно 17% експорту зрідженого природного газу Катаром—і змусив QatarEnergy оголосити форс-мажор за довгостроковими контрактами на термін до п'яти років.
CryptopulseElite1год тому
CNBC Джим Крамер назвав ринок "надзвичайно перепроданим", ймовірно посилаючись на біткойн
Gate News повідомлення, 20 березня, ведучий програми Mad Money під американським фінансовим медіа CNBC Джим Крамер висловив думку, що ринок перебуває у стані "дуже перепроданості", що може стосуватися біткойну (BTC). Конкретний зміст коментаря поки не розголошується.
GateNews1год тому
Криптовалютний ринок впав три дні поспіль, BTC звузив падіння і повернувся вище 70 тисяч доларів, блокчейн ігор зростає всупереч тренду
Криптовалютний ринок протягом трьох днів поспіль зазнає падіння, сектор SocialFi знизився на 4,65%, Bitcoin і Ethereum відповідно впали на 0,88% і 1,94%. У той час як GameFi показав зростання, Axie Infinity піднявся на 3,84%. Інші сектори зазнали загального спаду, деякі токени, такі як eCash і PIPPIN, трохи виросли. Загальні індекси секторів також демонструють різний рівень падіння.
GateNews2год тому
Аналітики рекомендують тримати «сухий порох» під час цінових коливань, BTC коливається біля позначки 70 тисяч доларів
Gate News повідомлення, 3 березня, певний аналітик рекомендував інвесторам тримати "сухий порох" (тобто резерви готівки або кошти, готові до інвестування) під час періодів коливання цін. У четвер ціна біткойна коливалася на рівні близько 70,377.59 доларів США та рухалася у напрямку 69,000 доларів.
GateNews2год тому

