Shiba Inu (SHIB) Price Hasn_t Done This in 9 Months
CryptoPotato
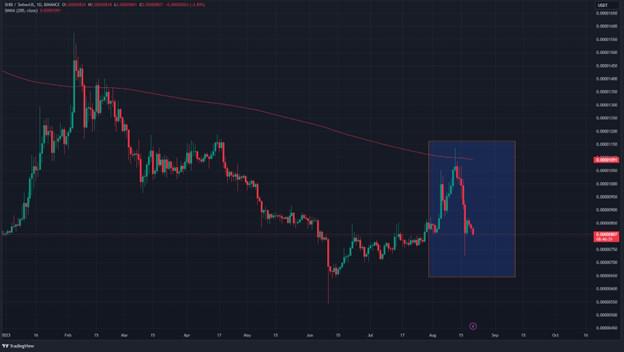
SHIB markets have been under sellers’ control for at least 8 of the past 9 days, indicating a win for bears.
The charts indicate that in the past 8 of 9 days, the daily candles have been closing as red. On Aug. 13, the chart shows the first red candle stick, with the daily low reported to be $0.00001013.
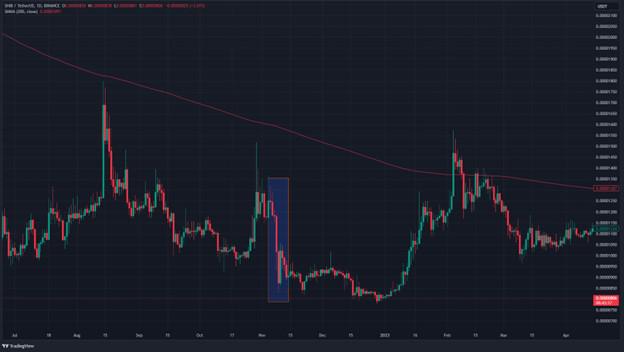
Last Happened 9 Months Ago
Shiba Inu last reported a trend 9 months ago, between Nov. 5 and 13. In this period, 8 of 9 daily candlesticks were red.
Is SHIB at a Local Bottom?
A look at the market charts indicates a reduction in the selling volumes of SHIB as the pattern ensues. Between 18th and 21st, the selling volumes have been diminishing. Analysts suggest that this reduction in selling volumes could mean that SHIB is already at its local bottom.
However, SHIB could still go lower to crash the levels at $0.0000077, $0.0000069, and $0.0000064. Initially a strong support level, the $0.000009 mark is now a tough resistance.
免责声明:本页面信息可能来自第三方,不代表 Gate 的观点或意见。页面显示的内容仅供参考,不构成任何财务、投资或法律建议。Gate 对信息的准确性、完整性不作保证,对因使用本信息而产生的任何损失不承担责任。虚拟资产投资属高风险行为,价格波动剧烈,您可能损失全部投资本金。请充分了解相关风险,并根据自身财务状况和风险承受能力谨慎决策。具体内容详见声明。
评论
0/400
暂无评论