Date: Fri, Dec 19 2025 | 12:45 PM GMT
The broader cryptocurrency market is showing relative strength despite concerns around the Japan rate hike. Cooling U.S. inflation has helped both Bitcoin (BTC) and Ethereum (ETH) hold in the green, and this stability is beginning to spill over into select altcoins, including Stellar (XLM).
XLM has posted modest gains today, but beyond the short-term price move, the daily chart is starting to reveal an emerging technical structure that could set the stage for a more meaningful recovery if key levels continue to hold.
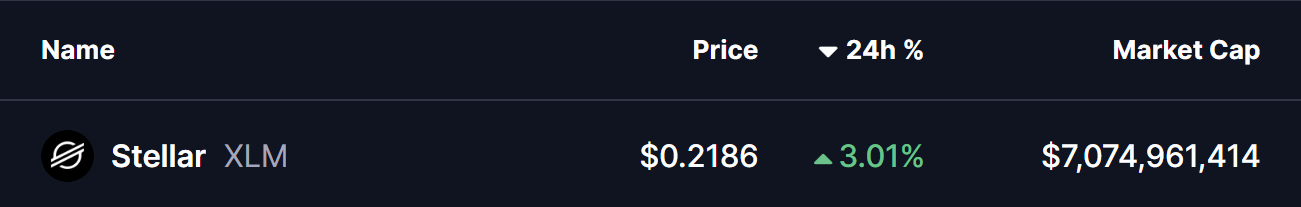
Source: Coinmarketcap
Harmonic Pattern Signals Potential Upside
On the daily timeframe, XLM appears to be forming a Bearish Cypher harmonic pattern — a setup that often generates upside momentum during its final CD leg before price reaches the Potential Reversal Zone (PRZ).
The pattern began at point X near the $0.3113 region, where XLM topped out before entering a sharp corrective phase. Price then declined into point A, followed by a rebound toward point B. From there, XLM rolled over again and extended lower into point C around the $0.2029 area, completing the core structure of the pattern.
Since tagging this low, XLM has started to stabilize and grind higher, currently trading near the $0.2188 level. This slow but steady recovery suggests that selling pressure may be fading, with buyers beginning to defend the recent lows more aggressively.
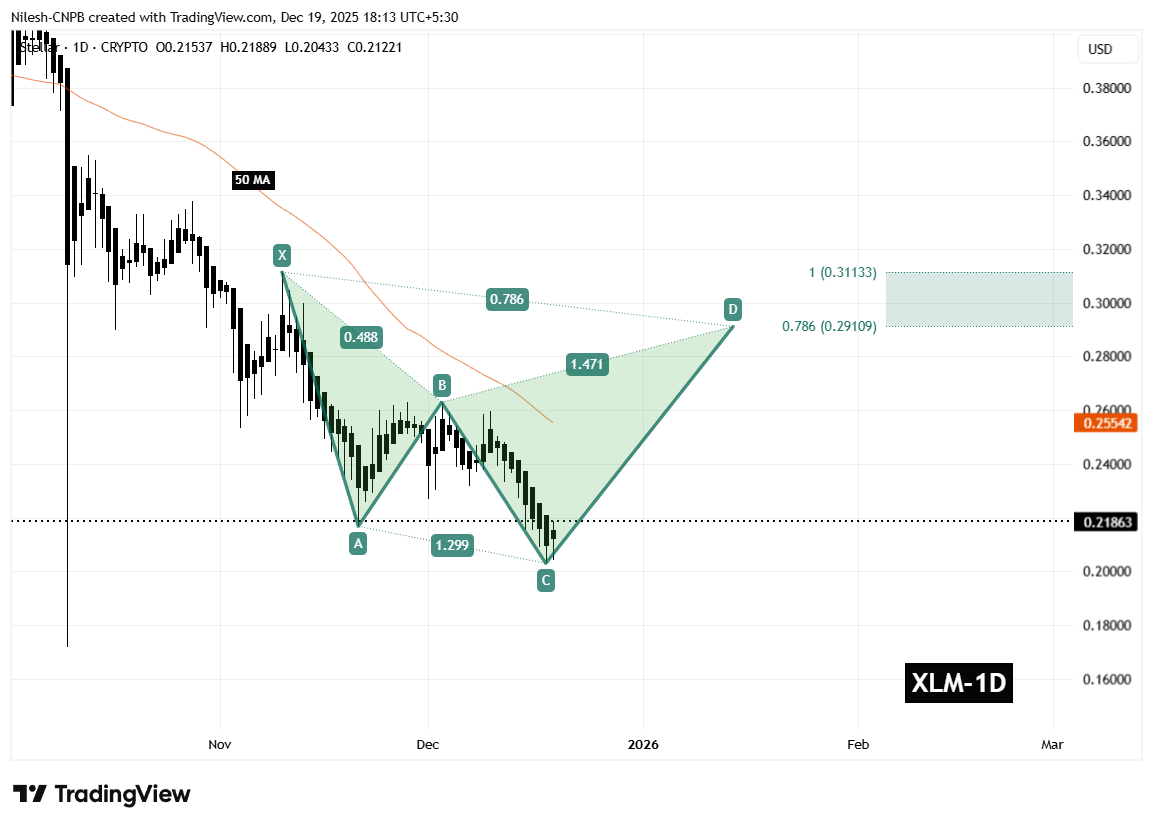
Stellar (XLM) Daily Chart /Coinsprobe (Source: Tradingview)
A key technical factor aligning with this structure is the 50-day moving average, currently positioned near $0.2554. This moving average has consistently acted as dynamic resistance throughout the downtrend and represents an important hurdle for bulls to overcome in the near term.
What’s Next for XLM?
In the short term, the most critical level to monitor is the C-leg support around $0.2029. As long as XLM holds above this zone, the harmonic pattern remains valid and the bullish CD-leg scenario stays intact.
If price continues to build strength from this base, the next major test will be a reclaim of the 50-day moving average near $0.2554. A decisive break and close above this level would signal improving momentum and could accelerate upside continuation.
Based on the harmonic structure, the projected upside targets sit within the Potential Reversal Zone, defined between the 0.786 Fibonacci extension near $0.2910 and the 1.0 extension around $0.3113. Reaching this zone would represent a potential upside of roughly 40–45% from current price levels, making it a key area where profit-taking or stronger resistance could emerge.
On the downside, failure to hold above the $0.2029 support would significantly weaken the bullish setup. A breakdown below this level could invalidate the harmonic structure and expose XLM to deeper downside pressure before any sustainable recovery attempt develops.
For now, the chart suggests Stellar is sitting at an important technical crossroads. While confirmation is still needed, the presence of a well-defined harmonic pattern indicates that a short- to medium-term bounce remains a realistic possibility if buyers continue to defend current levels and reclaim key resistance zones.
Disclaimer: The views and analysis presented in this article are for informational purposes only and reflect the author’s perspective, not financial advice. Technical patterns and indicators discussed are subject to market volatility and may or may not yield the anticipated results. Investors are advised to exercise caution, conduct independent research, and make decisions aligned with their individual risk tolerance.
Disclaimer: The information on this page may come from third parties and does not represent the views or opinions of Gate. The content displayed on this page is for reference only and does not constitute any financial, investment, or legal advice. Gate does not guarantee the accuracy or completeness of the information and shall not be liable for any losses arising from the use of this information. Virtual asset investments carry high risks and are subject to significant price volatility. You may lose all of your invested principal. Please fully understand the relevant risks and make prudent decisions based on your own financial situation and risk tolerance. For details, please refer to
Disclaimer.
Related Articles
Hyperliquid "Invades" Wall Street: On-Chain Whale Paradise Faces Direct Compliance Pressure
Hyperliquid, as a leading Perp DEX, is rapidly rising and attracting whale players, with massive trading volume and users exceeding 1.729 million. However, facing the rapid development of on-chain finance, compliance and regulatory challenges are becoming increasingly prominent. Hyperliquid has established a policy center to address these issues and seek legitimate status in mainstream finance.
PANews8m ago
Why Did Bitcoin Rise Today? BlackRock Invests $600 Million, Risk-Aversion Sentiment Shifts Due to US-Iran Tensions
Bitcoin surpassed $75,000 due to multiple factors including BlackRock's IBIT attracting $600 million in inflows, gains exceeding 11% since the U.S.-Iran conflict, and technical short squeeze dynamics. Gold ETF outflows indicate institutions are rotating funds toward Bitcoin. The key focus remains on interest rate policy signals from the March FOMC meeting.
MarketWhisper17m ago
Today the Fear and Greed Index rose to 28, with the market turning into a "panic state"
Gate News, March 17th, according to Alternative.me data, today's Cryptocurrency Fear and Greed Index rose to 28 (23 yesterday), with the market shifting from "extreme fear" to "fear" status.
GateNews46m ago
Bitcoin challenges 75K, Nvidia GTC drives AI token rally
Amid oil price declines, stock markets rebounded, and cryptocurrency market sentiment recovered to neutral levels. Bitcoin touched $74,899, challenging the 75K level. Nvidia's GTC conference drove significant gains in AI-related tokens, with the overall market showing positive momentum.
ChainNewsAbmedia1h ago
ETH Short-term Decline of 0.72%: Sell-side Dominance and Fund Outflow Intensify Risk-off Sentiment
2026-03-16 22:15至22:30(UTC),ETH价格在2355.0至2377.16 USDT区间快速下行,15分钟内收益率为-0.72%,振幅达0.93%。这一波动引发市场关注,交易量与链上活跃度均显著提升,短线波动加剧,情绪趋于谨慎。
本次异动的主要驱动力是急速上涨的卖出交易量与资金流出。ETH主网交易量较此前一小时均值大幅提升18.4%,买卖订单结构发生转变,卖出订单占比跃升至
GateNews2h ago
