
The broader cryptocurrency market continues to struggle with uneven and choppy price action, a phase that began following the sharp sell-off on October 10. That correction dragged Ethereum (ETH) lower by nearly 25% over the past 60 days, keeping risk appetite subdued across the altcoin space.
Meanwhile, Bitcoin Cash (BCH) has managed to hold its ground, posting over 11% gains over the same period. More importantly, its price action is beginning to form a structure that often precedes larger trend reversals, suggesting the recent strength may be more than just a short-term bounce.
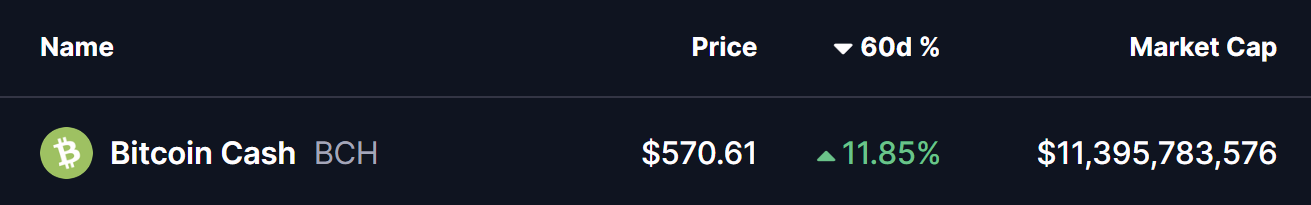
Source: Coinmarketcap
Rounding Bottom Taking Shape
On the daily timeframe, Bitcoin Cash appears to be carving out a rounding bottom formation — a classic bullish reversal pattern that reflects a gradual transition from distribution to accumulation. This type of structure typically forms after an extended correction, as selling pressure slowly fades and buyers begin stepping in with greater conviction.
The pattern began after BCH faced a firm rejection near the $630 region in September 2025. That rejection triggered a sharp decline, dragging price down toward the $446.9 area. Notably, sellers failed to force a deeper breakdown, and strong demand emerged around those lows. As weeks passed, BCH stabilized, volatility compressed, and price gradually curved higher, completing the rounded base visible on the chart.
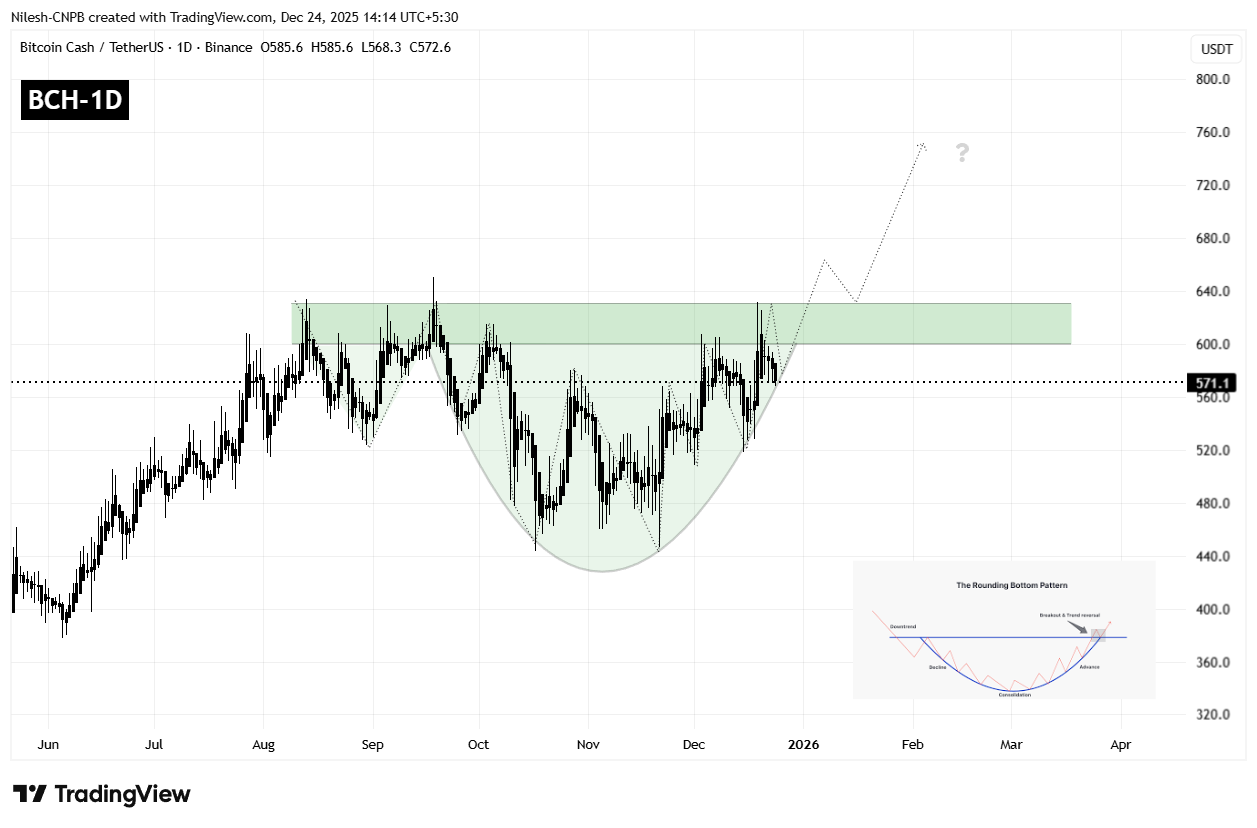
Bitcoin Cash (BCH) Daily Chart/Coinsprobe (Source: Tradingview)
Currently, BCH is trading near the $570 level and testing the lower support of the rounding base structure. This area is acting as a key inflection point, where buyers are attempting to defend the pattern and build momentum for a potential breakout attempt.
What’s Next for BCH?
A sustained bounce from the current zone, followed by a clean daily close above the $600–$630 resistance area, would confirm a bullish rounding bottom breakout. If price then manages to retest this zone and hold it as support, it would significantly strengthen the bullish case and suggest that a new upward leg is underway.
Based on the depth of the rounding structure, the projected upside target points toward the $800–$820 region. Reaching this zone would represent a potential upside of roughly 40% from current levels, aligning with the measured move typically associated with this pattern.
That said, patience remains essential. Before a confirmed breakout, BCH could still experience short-term pullbacks or consolidation below resistance. Until a decisive breakout and successful retest occur, the $600–$630 zone remains the key line in the sand that will determine whether Bitcoin Cash transitions into a sustained bullish phase or continues to trade within a broader range.
Disclaimer: The views and analysis presented in this article are for informational purposes only and reflect the author’s perspective, not financial advice. Technical patterns and indicators discussed are subject to market volatility and may or may not yield the anticipated results. Investors are advised to exercise caution, conduct independent research, and make decisions aligned with their individual risk tolerance.
Disclaimer: The information on this page may come from third parties and does not represent the views or opinions of Gate. The content displayed on this page is for reference only and does not constitute any financial, investment, or legal advice. Gate does not guarantee the accuracy or completeness of the information and shall not be liable for any losses arising from the use of this information. Virtual asset investments carry high risks and are subject to significant price volatility. You may lose all of your invested principal. Please fully understand the relevant risks and make prudent decisions based on your own financial situation and risk tolerance. For details, please refer to
Disclaimer.
Related Articles
BTC 15分钟下跌0.50%:大额持仓转移与多头清算引发连锁下行
2026年3月19日04:00至04:15(UTC),BTC价格在短线窗口内下挫0.50%,振幅达0.68%,价格区间为70729.6至71214.1 USDT。市场关注度显著提升,现货和衍生品交易量同步放大,短时活跃度增强,情绪略趋谨慎。
本次异动的主要驱动力是链上大额持仓约2,800 BTC在04:05—04:10集中转移至交易所热钱包,触发现货市场大额卖出,流动性压力上升,直接推动价格回
GateNews1m ago
Data: BTC breaks through $74,643, with the liquidation strength of major CEX short positions reaching $1.842 billion
Gate News reports that on March 19, according to Coinglass data, if BTC breaks through $74,643, the cumulative short liquidation intensity across mainstream CEX will reach $1.842 billion. Conversely, if BTC falls below $67,727, the cumulative long liquidation intensity across mainstream CEX will reach $1.172 billion.
GateNews5m ago
ETF Absorbs Over $1.1 Billion Yet Struggles to Rescue the Market? Powell and Oil Prices Team Up to Put Pressure On, Bitcoin Breaks Key Support
Despite Bitcoin ETF inflows of $1.16 billion, Bitcoin price pulled back to $71,000, declining over 4%. Analysts attribute the pullback to interest rate expectations and inflation pressures, while ETF inflows indicate that institutions view Bitcoin as a long-term asset. The weakness in U.S. equities has also impacted the crypto market.
GateNews51m ago
Gold and Bitcoin decline simultaneously by 3.6% and 4.6%, respectively, as the global market faces stagflation shocks.
On March 19, escalating geopolitical conflicts and hawkish Federal Reserve policies exposed global markets to stagflation pressures driven by oil. Rising oil prices, coupled with declining equities and metals, also impacted cryptocurrencies. Macroeconomic dynamics revealed intensifying energy tensions and widespread risk-averse sentiment across markets.
GateNews1h ago
