 SEI is finally getting a bit of relief after a rough stretch. Over the past day, the SEI price has pushed higher and reclaimed levels it recently lost, which naturally stands out in a market that’s still feeling cautious overall.
That said, this move doesn’t look like a full trend change just yet. The SEI chart indicates buyers stepped in at a familiar support zone, triggering a bounce, but whether that bounce can turn into something bigger is still an open question.
SEI is finally getting a bit of relief after a rough stretch. Over the past day, the SEI price has pushed higher and reclaimed levels it recently lost, which naturally stands out in a market that’s still feeling cautious overall.
That said, this move doesn’t look like a full trend change just yet. The SEI chart indicates buyers stepped in at a familiar support zone, triggering a bounce, but whether that bounce can turn into something bigger is still an open question.
- A Familiar SEI Support Zone Does Its Job
- Ecosystem Updates Help the Story, Not the Price
- The Bigger Market Still Feels Cautious
- What’s Next for SEI?
A Familiar SEI Support Zone Does Its Job
The SEI price rebound started near the $0.106 level, an area that has held up as support more than once. When price dipped into that zone again, buyers showed up quickly, helping SEI climb back above $0.110.
This type of move usually points to short-term traders reacting to levels rather than long-term investors stepping in. The RSI sitting around 38 supports that idea, showing there’s still room for upside without the market being overheated.
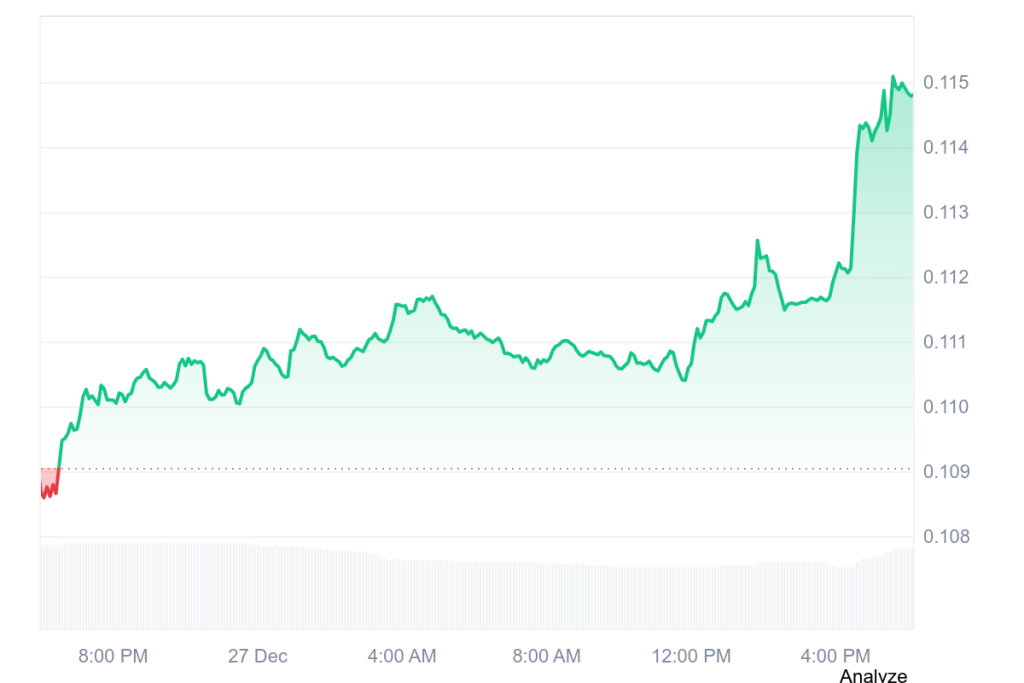
Source: CoinMarketCap/SEI
For now, the SEI price is pressing toward the $0.115 area, which is the next level traders are watching. The big picture is still about the same. The price sits under the 30-day moving average around $0.125, keeping the overall trend pressured.
Ecosystem Updates Help the Story, Not the Price
There was also some ecosystem news in the background. On December 25, Wormhole rolled out its Market Infrastructure Grid on Sei, connecting stablecoins like USDC and USDT with tokenization platforms such as Ondo and Securitize.
From a longer-term perspective, this fits well with Sei’s push toward institutional-grade infrastructure. It’s a positive step, but the market reaction was fairly muted. That indicates traders want to see real adoption before assigning much value to the update.
So far, on-chain activity, including TVL and transaction volume, hasn’t shown a meaningful jump, which limits how much this news can move price in the short term.
Read Also: Why Is Bitcoin Price Dipping? AI Says $75K Would Still Be Structurally Bullish
The Bigger Market Still Feels Cautious
Meanwhile, the SEI price climbed back amidst the wider crypto space inching up modestly, with the total market cap nudging higher; Bitcoin’s share of the market eases off a touch to give altcoins a bit of room to move.
Even so, sentiment remains defensive. The Fear and Greed Index is still deep in fear territory, and SEI’s open interest has dropped by nearly 12% over the past week. That points to traders reducing exposure rather than aggressively betting on a rally.
What’s Next for SEI?
Right now, the SEI price move looks like a technical bounce mixed with some cautious optimism. The most important level to watch is $0.110. Holding above it keeps the short-term recovery alive.
If momentum fades, a pullback toward $0.106 wouldn’t be surprising. For this move to turn into something more meaningful, SEI will need stronger volume and clearer signs of network growth.
Until then, today’s price action looks more like a pause in the downtrend than a confirmed reversal.
Disclaimer: The information on this page may come from third parties and does not represent the views or opinions of Gate. The content displayed on this page is for reference only and does not constitute any financial, investment, or legal advice. Gate does not guarantee the accuracy or completeness of the information and shall not be liable for any losses arising from the use of this information. Virtual asset investments carry high risks and are subject to significant price volatility. You may lose all of your invested principal. Please fully understand the relevant risks and make prudent decisions based on your own financial situation and risk tolerance. For details, please refer to
Disclaimer.
Related Articles
Bitcoin Surges to 76,000 USD, Outpacing Narratives of Gold and Oil Amid US-Iran Tensions - What's the Logic Behind It?
Bitcoin climbed to $76,000 on March 16, gaining nearly 20% cumulatively since the Iran-US conflict, outperforming both gold and the S&P 500. Analysts believe that cooling geopolitical risks, the establishment of Bitcoin's safe-haven properties, and changes in options structure have driven this rally, but this week's FOMC meeting will be an uncertainty factor. Historically, Bitcoin has fallen multiple times following rate decisions, with rising risks.
動區BlockTempo9m ago
Bitcoin Falls After Hitting $76,000 as Analysts Question How Fragile Derivatives-Driven Rally Is?
Bitcoin pulled back below $75,000 after hitting a six-week high of $75,912 on March 17, with gains driven primarily by short put option covering rather than fresh bullish capital inflows. Analysis indicates a lack of active bullish support in the near term, with the key support level of $74,400 becoming an important indicator for market direction.
動區BlockTempo13m ago
Aster DEX Trading Slows as Aster Coin Drops – Latest Aster Price Predictions
One of the most competitive sectors in DeFi this cycle has been the perpetual futures market, and Aster DEX remains an active participant in that space. However, the platform’s native asset, Aster Coin, has seen a significant correction since its strong debut in September 2025. After initially
Coinfomania14m ago
Crypto Market Shows Gains as US Diesel and Gasoline Prices Rise
The crypto market is experiencing gains amid rising diesel and gasoline prices in the US. BTC and ETH lead this upward trend, while gold and silver also see increases. However, market volatility persists due to inflation concerns and geopolitical factors.
TheNewsCrypto16m ago
XRP reclaims the fourth position in market capitalization: open interest surges, leverage returns as traders bet on a new rally
On March 17, XRP's price surged to $1.53, up 11% for the week, reclaiming the fourth position by market cap with a total market capitalization of approximately $93.4 billion. Trading volume and derivatives market activity are robust, with open interest reaching 3.53 billion contracts, reflecting increased market participation but also heightened volatility risks. Key near-term observation lies in the $1.50 to $1.60 range, with price performance set to influence subsequent trends.
GateNews17m ago
