
Date: Mon, Dec 22, 2025 | 12:45 PM GMT
The broader cryptocurrency market is showing relative strength at the start of the week, with both Bitcoin (BTC) and Ethereum (ETH) trading in the green. This stability in the majors has helped lift sentiment across the altcoin space, and** Bittensor (TAO)** is beginning to show early signs of a potential shift in momentum.
TAO is posting modest gains, but more importantly, its recent price action is starting to outline a clear technical structure on the daily chart. While the trend has been bearish for several weeks, the current setup hints that TAO could be positioning for another upside attempt if key levels are reclaimed.
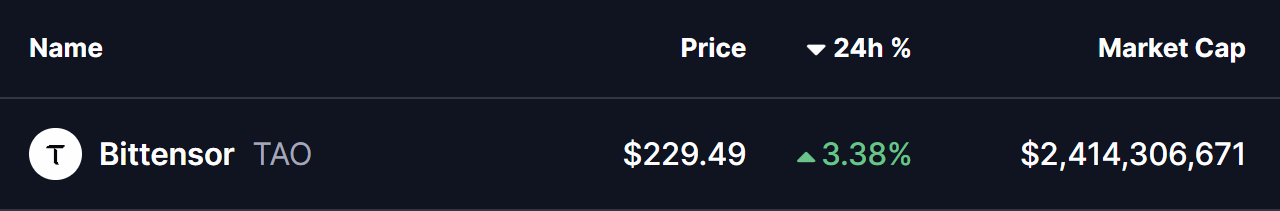
Source: Coinmarketcap
Power of 3 Pattern in Focus
On the higher-timeframe chart, TAO appears to be forming a classic Power of 3 structure, a pattern often associated with market cycle lows and early trend transitions. This structure typically unfolds in three stages: accumulation, manipulation, and expansion, with the strongest directional move usually emerging once the final phase begins.
Earlier, TAO spent a prolonged period moving sideways within a clearly defined range between $314.97 and $260.39. This low-volatility phase, highlighted by the grey box on the chart, reflects the accumulation stage, where price remained compressed and market participation gradually shifted from weak hands to stronger holders.
That period of balance eventually broke down as broader market pressure intensified. TAO lost the $260.39 support level and accelerated lower, sliding toward a recent low near $215.22. This sharp and impulsive move fits well with the manipulation phase of the Power of 3 pattern, where price briefly moves against the broader expectation to flush out late buyers and trigger stop losses.
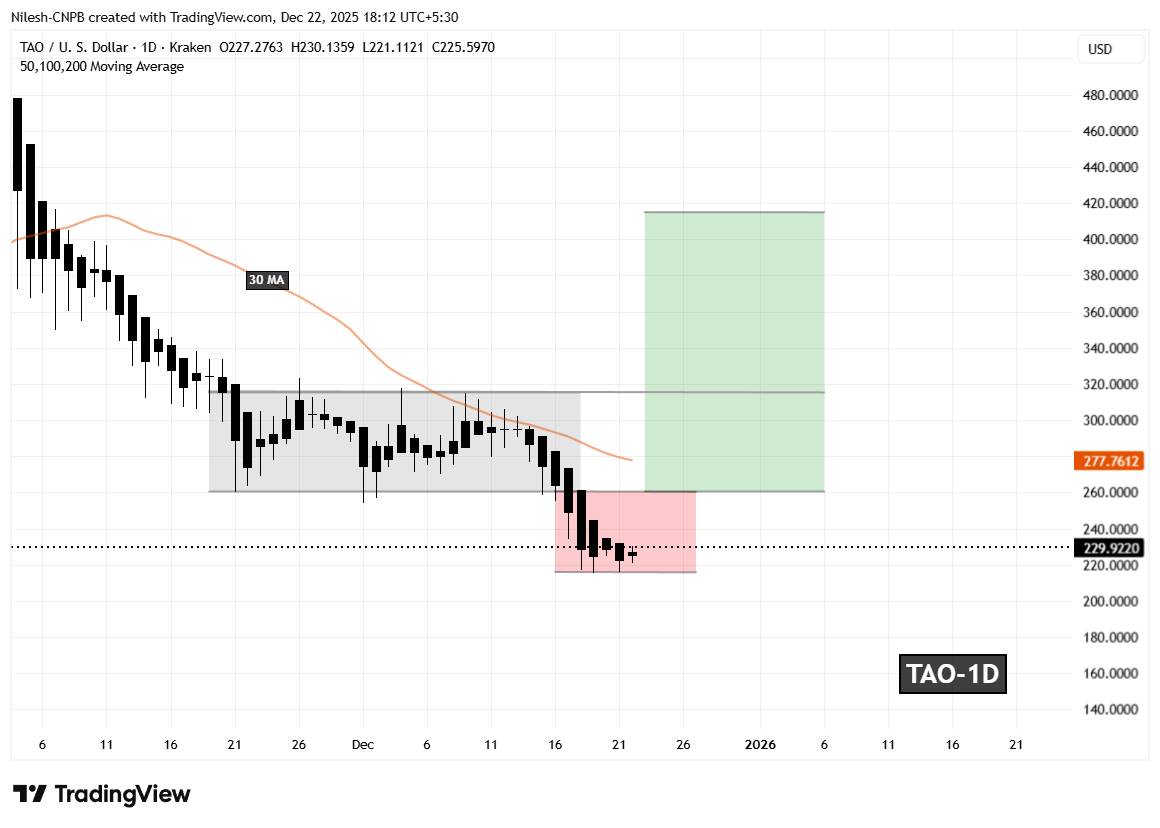
Bittensor (TAO) Daily Chart/Coinsprobe (Source: Tradingview)
Importantly, selling momentum has started to cool near this lower zone. The most recent daily candles show smaller bodies and reduced downside follow-through, suggesting that bearish pressure may be weakening. TAO is now consolidating near the lows, which often signals that the market is attempting to stabilize after an aggressive sell-off.
What’s Next for TAO?
At the time of writing, TAO continues to trade within the broader manipulation zone, which calls for caution. The trend has not yet confirmed a reversal, but the structure is beginning to develop conditions that could support one.
For the bullish scenario to gain traction, TAO needs to reclaim the $260.39 level and establish acceptance above the declining 30-day moving average, which is currently acting as dynamic resistance. A sustained move back into the previous range would suggest that the manipulation phase is likely complete and that the market may be transitioning toward the expansion phase of the pattern.
If buyers manage to push price above $314.97 and hold that level as support, the chart projection opens the door for a move toward the $414.65 region. This area represents the measured expansion target from the prior range and implies a potential upside of roughly 80% from current levels if momentum accelerates.
That said, this setup remains highly conditional. As long as TAO trades below $260.39, downside risks cannot be ruled out, and the market remains vulnerable to further volatility. Holding recent lows and reclaiming key resistance zones will be critical for bulls looking to validate a bullish reversal narrative in the days ahead.
Disclaimer: The views and analysis presented in this article are for informational purposes only and reflect the author’s perspective, not financial advice. Technical patterns and indicators discussed are subject to market volatility and may or may not yield the anticipated results. Investors are advised to exercise caution, conduct independent research, and make decisions aligned with their individual risk tolerance.
Disclaimer: The information on this page may come from third parties and does not represent the views or opinions of Gate. The content displayed on this page is for reference only and does not constitute any financial, investment, or legal advice. Gate does not guarantee the accuracy or completeness of the information and shall not be liable for any losses arising from the use of this information. Virtual asset investments carry high risks and are subject to significant price volatility. You may lose all of your invested principal. Please fully understand the relevant risks and make prudent decisions based on your own financial situation and risk tolerance. For details, please refer to
Disclaimer.
Related Articles
Gold Plunges Below 4500! Stocks, Bonds, and Gold All Selling Off—Is Cash Really the Safe Haven King?
Gold has declined to $4,500 since late February 2026 due to geopolitical conflicts, with global capital markets in turmoil, the S&P 500 down 5%. U.S. Treasury yields are rising, safe-haven assets are underperforming, and capital flows into money market funds have reached historic highs, indicating a market preference for "cash is king." Bitcoin is experiencing volatility and has not yet established itself as a safe-haven asset.
ChainNewsAbmedia50m ago
Today the cryptocurrency fear and greed index rose to 12, with the market in a state of extreme panic.
Gate News Update: On March 21st, according to Alternative.me data, the Cryptocurrency Fear and Greed Index rose to 12 today (the index was 11 yesterday), with the market in an "extreme panic state."
GateNews52m ago
Canton (CC) Price in a Downtrend – Analyst Says the Drop Isn’t Over
Sometimes the market tells you exactly what it’s going to do. You just have to be paying attention. For Canton, the story has been pretty clear for a while now. Down, and then more down.
Sjuul from AltCryptoGems caught this one early. He spotted that bearish rejection just in time, and since t
CaptainAltcoin2h ago
BTC rises 0.52% in 15 minutes: Major capital net inflows to exchanges and multiple market resonance driving the move
2026-03-20 21:15 to 21:30 (UTC), BTC recorded +0.52% return in 15 minutes, with a price range of 70124.0 to 70586.6 USDT, and amplitude of 0.66%. This round of volatility occurred against a backdrop of increased market attention and heightened fluctuations, with both on-chain and market participants showing highly active behavior.
The main driver of this volatility was whale funds (entities holding >=1,000 BTC) making a net inflow of 4,091.39 BTC to exchanges within 24 hours, data significantly exceeding the average for the same period. Concentrated net inflows
GateNews3h ago
Bitcoin Has Stabilized, But Investors Are Paying Up for Downside Protection: VanEck
Bitcoin's volatility has decreased to around $70,000, but traders are still heavily investing in downside protection. Although premiums for puts have dropped, they remain high historically, suggesting caution among investors. This defensiveness may signal an impending price bottom, as similar market conditions in the past have led to recoveries.
Decrypt4h ago
