
Date: Fri, Dec 26, 2025 | 06:30 PM GMT
The broader cryptocurrency market has been navigating a period of choppy and uncertain price action over the past several weeks, a phase that began after the sharp market-wide sell-off on October 10. During that correction, Ethereum (ETH) dropped nearly 28% over the last 60 days, applying sustained pressure across the altcoin sector — including ether.fi (ETHFI).
ETHFI has mirrored this weakness, sliding more than 31% over the same period. However, despite the sharp downtrend, recent price behavior suggests selling pressure may be easing. The token is now trading near a historically significant demand zone, where buyers have repeatedly stepped in before — raising the possibility that ETHFI could be approaching an inflection point.
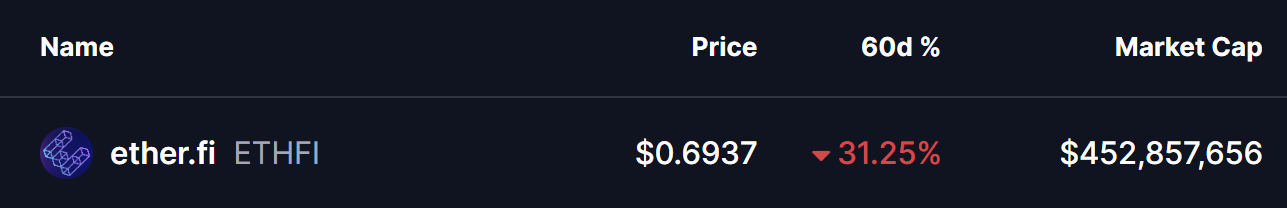
Source: Coinmarketcap
Double Bottom Pattern in Focus
On the daily timeframe, ETHFI appears to be forming a potential double-bottom structure — a classic reversal pattern that often signals exhaustion among sellers. The setup began after ETHFI was rejected from the $0.9233 resistance area, a move that triggered a sharp decline of nearly 28% and pushed price back toward the lower end of its range.
That sell-off dragged ETHFI into the $0.65 support zone, a level that has consistently acted as a strong demand area in the past. The chart now shows price revisiting this same region and stabilizing once again, suggesting buyers are actively defending it. The similarity between the first and second lows strengthens the case that a double-bottom base may be forming.
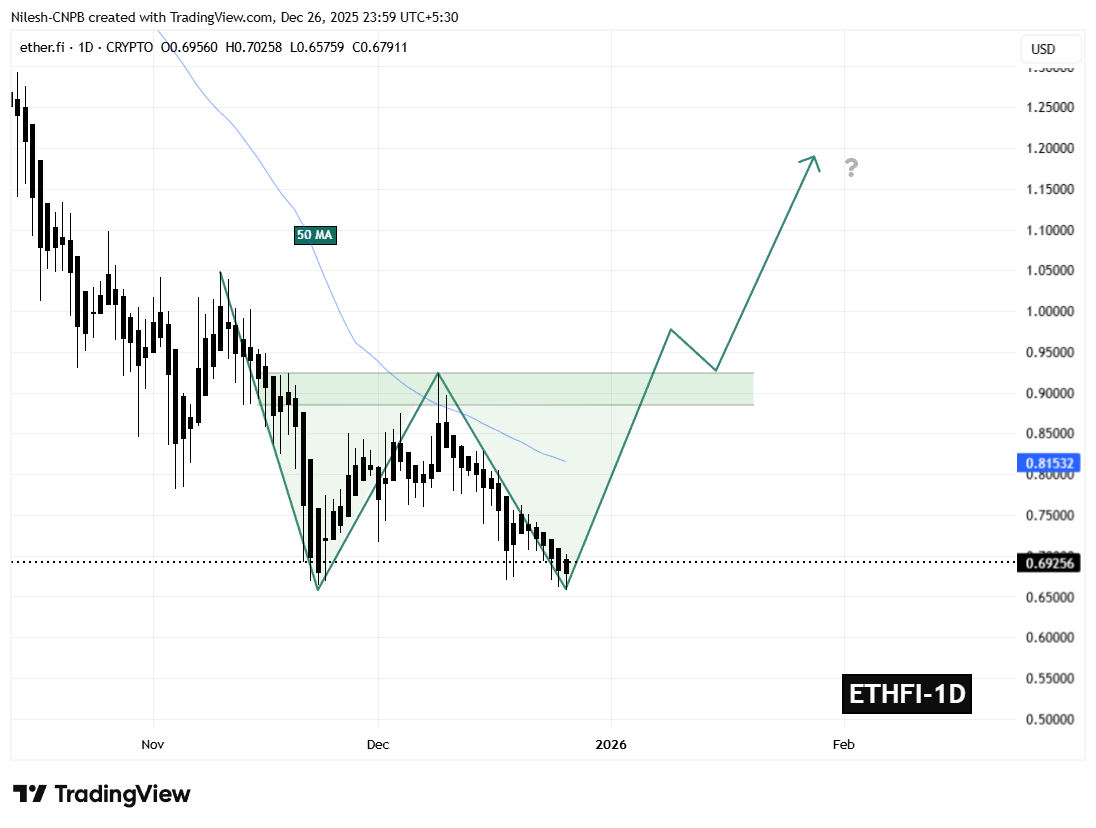
ETHFI Daily Chart/Coinsprobe (Source: Tradingview)
If this support continues to hold, the ongoing consolidation could mark the completion of the second bottom — a critical step in shifting momentum away from sellers and toward a potential trend reversal.
What’s Next for ETHFI?
The $0.65 support zone remains the most important level to monitor in the near term. As long as ETHFI holds above this area, the developing bullish structure remains valid and provides room for momentum to gradually rebuild.
On the upside, the first major challenge sits at the 50-day moving average near $0.8153. This level has repeatedly capped recovery attempts throughout the recent downtrend and now represents the initial test for buyers. A sustained move above this moving average would signal improving market structure and growing bullish confidence.
Beyond that, the $0.9233 neckline stands as the key confirmation level. A decisive breakout above this resistance would complete the double-bottom pattern and significantly strengthen the bullish outlook, potentially opening the door for a broader recovery move in the weeks ahead.
For now, ETHFI finds itself at a technically pivotal zone — one that could either reinforce the existing downtrend or mark the beginning of a meaningful rebound if buyers continue to defend support.
Disclaimer: The views and analysis presented in this article are for informational purposes only and reflect the author’s perspective, not financial advice. Technical patterns and indicators discussed are subject to market volatility and may or may not yield the anticipated results. Investors are advised to exercise caution, conduct independent research, and make decisions aligned with their individual risk tolerance.
Disclaimer: The information on this page may come from third parties and does not represent the views or opinions of Gate. The content displayed on this page is for reference only and does not constitute any financial, investment, or legal advice. Gate does not guarantee the accuracy or completeness of the information and shall not be liable for any losses arising from the use of this information. Virtual asset investments carry high risks and are subject to significant price volatility. You may lose all of your invested principal. Please fully understand the relevant risks and make prudent decisions based on your own financial situation and risk tolerance. For details, please refer to
Disclaimer.
Related Articles
XRP Today’s News: Goldman Sachs Holds 154 Million XRP in ETF, Institutional Buying Fails to Drive Up the Price
Goldman Sachs has become the largest public holder of XRP spot ETF with a position of approximately $154 million, but this institutional signal has yet to be reflected in the coin price, with XRP still hovering around $1.29. Technical analysis shows that the $1.50 support level is critical, and a breakthrough could push prices higher.
MarketWhisper18m ago
Whale Buys Million in Ethereum! Low-Level Rebound Signals Emerge, Is ETH Price Inflection Point Coming?
Recently, an Ethereum whale returned to the market, purchasing 50,706 ETH with 111 million USDT, demonstrating confidence in the current price. Meanwhile, other large wallets have exhibited similar buying behavior, elevating market attention toward Ethereum. Although Ethereum's price continues to face pressure, institutional capital inflows and improved regulatory environment in the United States provide certain support to the market, potentially establishing mid-term support levels.
GateNews21m ago
Today's cryptocurrency fear and greed index dropped to 23, with the market shifting to an extremely fearful state.
Gate News: On March 19, according to Alternative.me data, today's cryptocurrency Fear and Greed Index dropped to 23, with the market transitioning from yesterday's "panic state" (index 26) to "extreme panic state."
GateNews1h ago
Why Did Bitcoin Decline Today? Powell Sends Hawkish Signals, Trump Considers Troop Increase in Middle East
Bitcoin fell to $70,767 on March 19 following hawkish signals from Federal Reserve Chairman Powell, who warned that rising oil prices could exacerbate inflation; meanwhile, U.S. military troop reinforcements in the Middle East heightened geopolitical risks. The $70,000 level is a critical support for Bitcoin, and a break below it could accelerate further downside.
MarketWhisper1h ago
Here’s Why River (RIVER) Price Is Pumping Today
RIVER's price surged 25% to $27.54, driven by a bullish inverse head-and-shoulders breakout and increased trading volume. Analysts project further gains as traders respond to market conditions and ongoing ecosystem campaigns, indicating strong support for the price.
CaptainAltcoin5h ago
Brandt Spotlights 'Ugly' Bitcoin Pattern - U.Today
Peter Brandt advises Bitcoin traders to remain flexible amidst conflicting technical setups: a potential bullish "horn" pattern and a bearish "flag" pattern. He criticizes the dogmatic mindset of some in the crypto community, emphasizing adaptable trading strategies over fixed opinions.
UToday6h ago
