
Date: Thu, Jan 01, 2026 | 10:30 AM GMT
As the new year 2026 begins, the broader cryptocurrency market is showing modest weakness, with both Bitcoin (BTC) and Ethereum (ETH) trading slightly in the red. This soft start has weighed on sentiment across the altcoin space as well, including Monad (MON). However, beneath the surface, MON’s chart structure is beginning to tell a more constructive story.
MON is currently down around 4% on the day, extending its 60-day decline to roughly 21%. While short-term price action remains subdued, the more important signal is emerging on the daily chart, where price structure is beginning to hint at a meaningful shift. If confirmed, this setup could mark the early stages of a bullish continuation following a prolonged corrective phase.
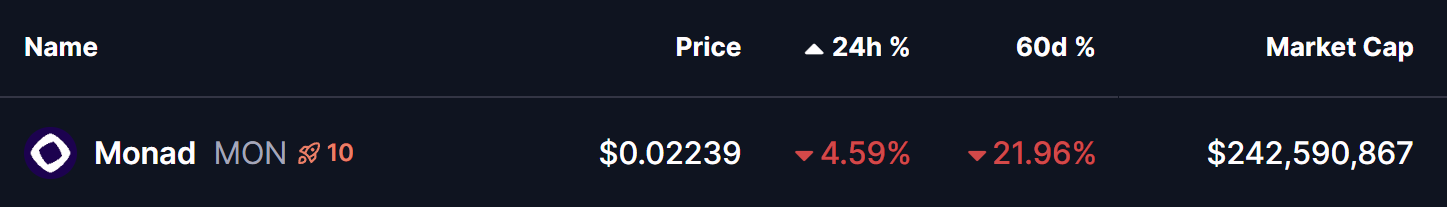
Source: Coinmarketcap
Rounding Bottom in Play
On the daily timeframe, MON appears to be forming a textbook rounding bottom pattern — a classic bullish reversal structure that typically develops after extended downside pressure. This pattern reflects a gradual transition from distribution to accumulation, where selling momentum weakens and buyers begin to step in more consistently.
Previously, MON faced strong rejection near the $0.04923 neckline zone, triggering a sharp decline that unfolded through late November and December. That move eventually found a floor near the $0.017 level, which has since acted as a key demand zone. Repeated defenses of this area prevented any deeper breakdown and helped establish a stable base for a potential trend reversal.
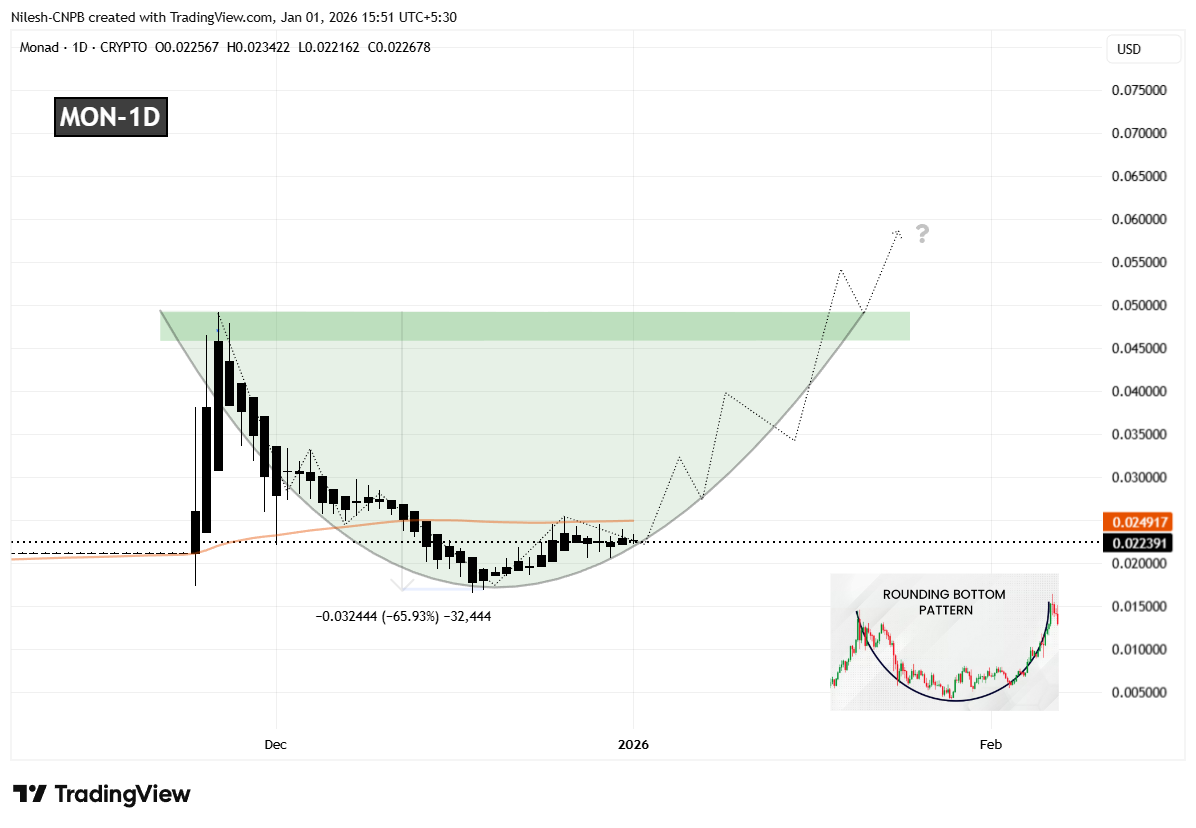
Monad (MON) Daily Chart/Coinsprobe (Source: Tradingview)
Since forming that bottom, MON has started to curve higher in a rounded fashion, closely matching the classic structure of a developing bottoming pattern. This gradual recovery suggests that selling pressure is fading rather than accelerating. The recent stabilization and recovery back above the $0.022 region further indicate that accumulation may be taking place as the market quietly prepares for a larger move.
What’s Next for MON?
For the rounding bottom pattern to move into confirmation, MON needs to reclaim the 50-day moving average, currently positioned near the $0.02491 level. A sustained move above this area would signal a shift in short-term momentum and confirm that buyers are beginning to regain control after months of corrective price action.
Looking ahead, the most significant technical hurdle remains the neckline resistance around $0.04923. A clean and decisive breakout above this zone would validate the entire reversal structure and could open the door for a broader bullish expansion phase, with momentum traders likely returning to the market.
Until those levels are reclaimed, the pattern remains in its early development stage. Short-term pullbacks or consolidation remain possible if MON struggles near the 50-day moving average. However, as long as price continues to hold higher lows above the $0.017 base, the broader bottoming structure remains intact.
Overall, MON’s emerging rounding bottom formation suggests the token may be approaching an important inflection point. While confirmation is still pending, the improving structure and alignment with a classic bullish pattern indicate that the coming sessions could be decisive for Monad’s next directional move.
Disclaimer: The views and analysis presented in this article are for informational purposes only and reflect the author’s perspective, not financial advice. Technical patterns and indicators discussed are subject to market volatility and may or may not yield the anticipated results. Investors are advised to exercise caution, conduct independent research, and make decisions aligned with their individual risk tolerance.
About Author: Nilesh Hembade is the Founder and Lead Author of Coinsprobe, with over 5 years of experience in the cryptocurrency and blockchain industry. Since launching Coinsprobe in 2023, he has been providing daily, research-driven insights through in-depth market analysis, on-chain data, and technical research.

Disclaimer: The information on this page may come from third parties and does not represent the views or opinions of Gate. The content displayed on this page is for reference only and does not constitute any financial, investment, or legal advice. Gate does not guarantee the accuracy or completeness of the information and shall not be liable for any losses arising from the use of this information. Virtual asset investments carry high risks and are subject to significant price volatility. You may lose all of your invested principal. Please fully understand the relevant risks and make prudent decisions based on your own financial situation and risk tolerance. For details, please refer to
Disclaimer.
Related Articles
Chainlink Dominates Discussion in RWA Sector
The RWA (Real World Asset) tokenization sector is drawing significant attention, highlighted by Chainlink's dominance with 14.2 million interactions, far surpassing other projects. The article examines market perceptions and potential for growth among top projects like ONDO and AVAX.
TapChiBitcoin48m ago
Fear and Greed Index Returns Above 40, BTC Weekly Gains 5.66%, ETH Weekly Gains 13%
Data from Xinfire Research Institute shows that from March 11-18, the Nasdaq index declined 1.26%, Bitcoin rose 5.66%, and Ethereum gained 13%. The Fear and Greed Index has exited the extreme fear zone. The Federal Reserve will release statements related to rate cuts tomorrow.
GateNews1h ago
Bitcoin Pulls Back to $73,500, Ethereum Consolidates at $2,300, CryptoQuant: Uptrend Faces Double Resistance, Fed Decision Thursday Becomes Key
Bitcoin reached a high of 75,500 USD today before pulling back to 73,910 USD. CryptoQuant points out that there is double resistance in the 75,000 to 85,000 USD range. The market is awaiting the Federal Reserve's interest rate decision announcement and Powell's assessment of stagflation. If the results are hawkish, it will increase resistance at the 75,000 USD level. Overall market sentiment remains consolidating sideways.
動區BlockTempo2h ago
CryptoQuant Alert: Bitcoin Bounce May Face Resistance Between 75,000 and 85,000 USD
CryptoQuant report shows bullish signals in the Bitcoin futures market, but if the price continues to rise, it will encounter resistance near $75,000 and $85,000. Meanwhile, the inflow of Bitcoin into centralized exchanges is accelerating, which may signal potential selling pressure, creating a contradiction with the bullish sentiment in the futures market.
MarketWhisper3h ago
Why Did Bitcoin Fall Today? Iran's Key Leader Dies, Hormuz Strait Faces Blockade Again
Recent reasons for Bitcoin's decline include geopolitical conflict uncertainty triggered by the death of Iranian wartime official Larijani, the blockade of the Strait of Hormuz pushing oil prices above $100, exacerbating inflation pressures and reducing Federal Reserve rate cut expectations, as well as institutional capital withdrawal. On the technical side, $72,000 is an important support level, and a break below could lead to further exploration toward $64,000.
MarketWhisper3h ago
Today's cryptocurrency fear and greed index fell to 26, with the market in a state of panic
Gate News Report: On March 18, Alternative.me data shows that today's cryptocurrency fear and greed index dropped to 26, with the market in a "panic state." Yesterday, the index was at 28, also in a "panic state."
GateNews3h ago
