
Pai Coin 4-hour chart shows a clear ascending triangle pattern, with the price rebounding strongly from the support trendline and approaching the resistance zone of $0.2129 to $0.2160. Bitcoin and Ethereum have risen over 7% this week, boosting market sentiment. Pai Coin’s technical breakout conditions are now mature, with a target of $0.2404, representing a potential increase of about 13%.
Three Major Bullish Signs of Pai Coin’s Ascending Triangle
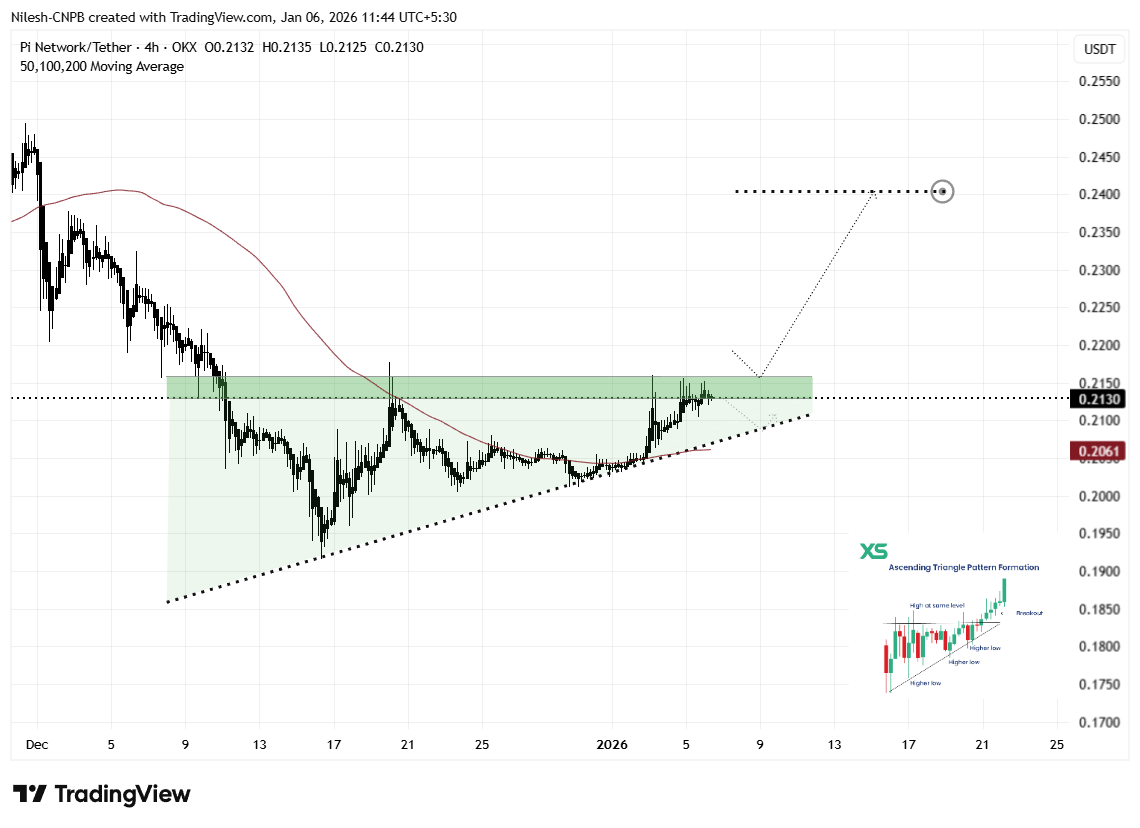
(Source: Trading View)
Pai Coin is forming a textbook ascending triangle pattern on the 4-hour chart. The core feature of this pattern is a series of higher lows continuously approaching a flat resistance zone, indicating that despite multiple rejections at the same level, buying interest remains strong. Ascending triangles are generally considered bullish continuation patterns, especially when they appear after a prolonged consolidation, with a significantly increased probability of a successful breakout.
The first bullish sign is the continuous elevation of lows. Recently, Pai Coin rebounded strongly near the upward support trendline, with the price once again approaching the upper boundary of the triangle. Each pullback is supported at higher levels, demonstrating that buyers still control the market and are willing to buy on dips rather than close positions. This dip-buying behavior is a typical characteristic of institutional and smart money participation.
The second bullish sign is the ongoing narrowing of volatility. As the price oscillates between the upward support line and the horizontal resistance line, the range of fluctuation gradually decreases. This compression process is similar to a spring being squeezed tighter and tighter; once the direction breaks out, the energy released often propels the price rapidly. Historically, initial moves after an ascending triangle breakout tend to be swift, providing traders with a shorter entry window.
The third bullish sign is multiple tests of resistance without breaking support. Pai Coin has tested the $0.2160 resistance level several times, but each time the pullback after failure is shallower than the previous, and the support trendline remains effective. This behavior indicates that selling pressure is gradually being absorbed. Once the last batch of profit-taking and panic selling are cleared, breaking resistance will become relatively easier.
Key Price Levels and Breakout Path
Currently, Pai Coin is in the third or fourth test of the $0.2160 resistance level. According to technical analysis theory, the more times a resistance is tested, the higher the probability of a successful breakout, as each test consumes some selling pressure. If the price can decisively break above this resistance and sustain above it, then retest the resistance as support, it will confirm the ascending triangle structure and potentially trigger a stronger rally.
The confirmation of a breakout is not only about the price piercing the resistance level but also about volume. An ideal breakout should be accompanied by a significant increase in volume, indicating genuine buying interest rather than a false breakout. Additionally, a daily close above $0.2160 is another critical confirmation signal. Temporary intraday breakouts may be false signals; only a close above the level can reduce the risk of being trapped by a false breakout.
Using the classic measurement method for ascending triangles, the target price after breakout is usually the vertical distance from the pattern’s bottom to the resistance level added to the breakout point price. Based on this calculation, Pai Coin’s technical upside target is around $0.2404. This target aligns with previous price structures, further reinforcing the bullish outlook. More aggressive traders might even set their target at the psychological level of $0.25.
Three Key Price Thresholds for Pai Coin Breakout
First threshold: $0.2160 (current resistance, breakout requires volume confirmation)
Second threshold: $0.2200 (psychological level, daily close above needed to confirm trend)
Third threshold: $0.2404 (technical measurement target, representing about 13% potential gain)
Risk Management and Trading Strategy
Although the technical signals are clearly bullish, caution remains essential. Pai Coin only gained about 5% over the past week, significantly less than Bitcoin and Ethereum’s 7% rise, indicating that Pai Coin’s upward momentum might be somewhat lacking. If Pai Coin fails to break the resistance, the price could fall back toward the upward support trendline. As long as this support line remains valid, the overall bullish structure stays intact.
However, if the price drops sharply below the upward support trendline, the pattern will invalidate, and any breakout attempt will be delayed. This invalidation often leads to rapid declines, as technical traders relying on the pattern will quickly cut losses. Therefore, strict stop-loss placement is crucial. Conservative traders can set stops about 2-3% below the support line, while aggressive traders might place stops just below the recent support lows.
From a risk-reward perspective, the current Pai Coin trade setup is relatively favorable. Entering at the current price with a stop-loss below the support line and a target at $0.2404 offers a risk-reward ratio of approximately 1:2.5, which is considered ideal in technical trading. Investors should only commit funds they can afford to lose and avoid excessive leverage.
With 2026 approaching, the overall cryptocurrency market continues to show strong momentum. This recovery trend is gradually spreading to mainstream cryptocurrencies like Pai Coin. The dual signals of improving market sentiment and the tightening of the ascending triangle pattern suggest Pai Coin is approaching a critical turning point—one that could determine its next major move in the new year.
Disclaimer: The information on this page may come from third parties and does not represent the views or opinions of Gate. The content displayed on this page is for reference only and does not constitute any financial, investment, or legal advice. Gate does not guarantee the accuracy or completeness of the information and shall not be liable for any losses arising from the use of this information. Virtual asset investments carry high risks and are subject to significant price volatility. You may lose all of your invested principal. Please fully understand the relevant risks and make prudent decisions based on your own financial situation and risk tolerance. For details, please refer to
Disclaimer.
Related Articles
Amundi Launches $100 Million Tokenized Fund on Ethereum and Stellar Using Chainlink Oracle
Europe's largest asset manager Amundi, with approximately €2.4 trillion in assets under management, partnered with tokenization platform Spiko on March 19, 2026, to launch the $100 million Spiko Amundi Overnight Swap Fund (SAFO), utilizing Chainlink as the underlying oracle infrastructure to record Net Asset Value (NAV) directly on the Ethereum and Stellar blockchains.
CryptopulseElite13m ago
Citigroup Cuts Bitcoin Price Target to $112,000, Legislative Gridlock Weighs on Valuation
Citigroup lowered its 12-month Bitcoin price target to $112,000, primarily due to the stalled progress of the U.S. CLARITY Act in the Senate, which has dampened regulatory expectations. Meanwhile, Ethereum's price target was also adjusted to $3,175, facing dual pressure from policy delays and weakening on-chain activity. Analysts pointed out that future legislative opportunities are shrinking, and the market needs to recalibrate its risk assessment.
MarketWhisper33m ago
On-chain address cleaned out BTC and ETH positions, taking $1.75M profit before opening $39.4M long position
On March 20th, address 0x94d closed out 105 million dollars in BTC and ETH short positions, realizing profits of approximately 1.75 million dollars, then reversed to open long positions. The current long position size has reached 39.4 million dollars with unrealized losses of approximately 10,000 dollars. This address is known for reverse operations and excels at swing trading.
GateNews56m ago
Citigroup Slashes Bitcoin Price Target! Legislative Progress Falls Short of Expectations, Policy Tailwinds Unlikely to Materialize in Near Term
Citigroup has lowered its 12-month target prices for Bitcoin and Ethereum mainly due to delays in U.S. cryptocurrency legislation and increased macroeconomic uncertainty, indicating a cautious market attitude toward the medium-term outlook for crypto assets. After the revision, the target price for Bitcoin is now $112,000, and for Ethereum, $3,175. In the short term, the market may trade within a range amid ongoing uncertainty, and regulatory clarity may take longer to emerge.
CryptoCity1h ago
BlackRock Ether Staking Fund Reaches $254 Million in Assets One Week After Launch
BlackRock's iShares Staked Ethereum Trust (ETHB) has accumulated $254 million in assets under management since its launch on March 12, with inflows of $146 million and staked Ethereum comprising 70-95% of holdings. Monthly staking rewards are distributed to investors at 82%, with sponsor fees discounted to 0.12%.
GateNews2h ago
Ethereum Tests Critical Support Zone, Risk of Breakdown and Extended Downtrend?
The Ethereum Foundation has allocated 3,400 ETH to the decentralized lending protocol Morpho, enhancing its treasury strategy. This includes 1,000 ETH in Morpho Vaults V2, aimed at sustainable DeFi yields, following an earlier deployment of 2,400 ETH last October.
TapChiBitcoin2h ago
