
Date: Fri, Jan 02, 2026 | 09:15 AM GMT
The broader cryptocurrency market has started the new year on a stable footing, with both Bitcoin (BTC) and Ethereum (ETH) trading slightly higher and posting gains of over 1.5%. This modest strength across major assets has provided breathing room for risk-on sentiment, allowing several memecoins to show early signs of recovery — including Popcat (SOL) (POPCAT).
POPCAT is currently trading by solid 19% higher on the day, but the more important development lies in its broader technical structure. After months of consistent downside pressure, the price action is now beginning to hint at a potential trend reversal, supported by a well-defined bullish pattern forming on the daily chart.
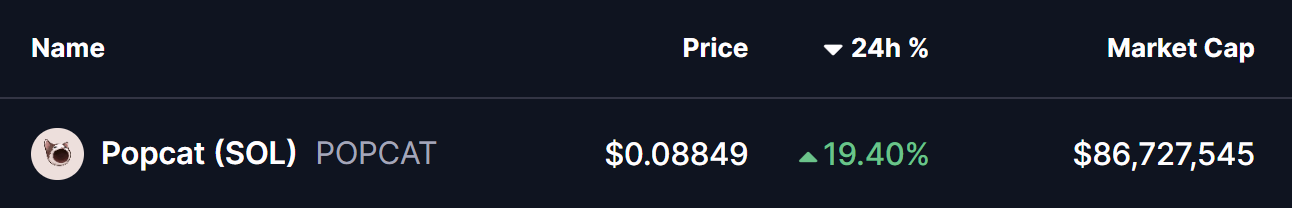
Source: Coinmarketcap
Falling Wedge Pattern in Play
On the daily timeframe, POPCAT appears to be carving out a falling wedge formation — a classic bullish reversal pattern that often develops after extended downtrends. This structure is characterized by lower highs and lower lows that gradually converge, reflecting weakening selling pressure and growing buyer interest near the lows.
Following weeks of steady decline, POPCAT recently established a local bottom near the $0.0725 region. This area acted as a strong demand zone, where buyers stepped in aggressively and prevented further downside. The resulting rebound pushed price back toward the $0.088 level, placing POPCAT just beneath the wedge’s upper resistance trendline.
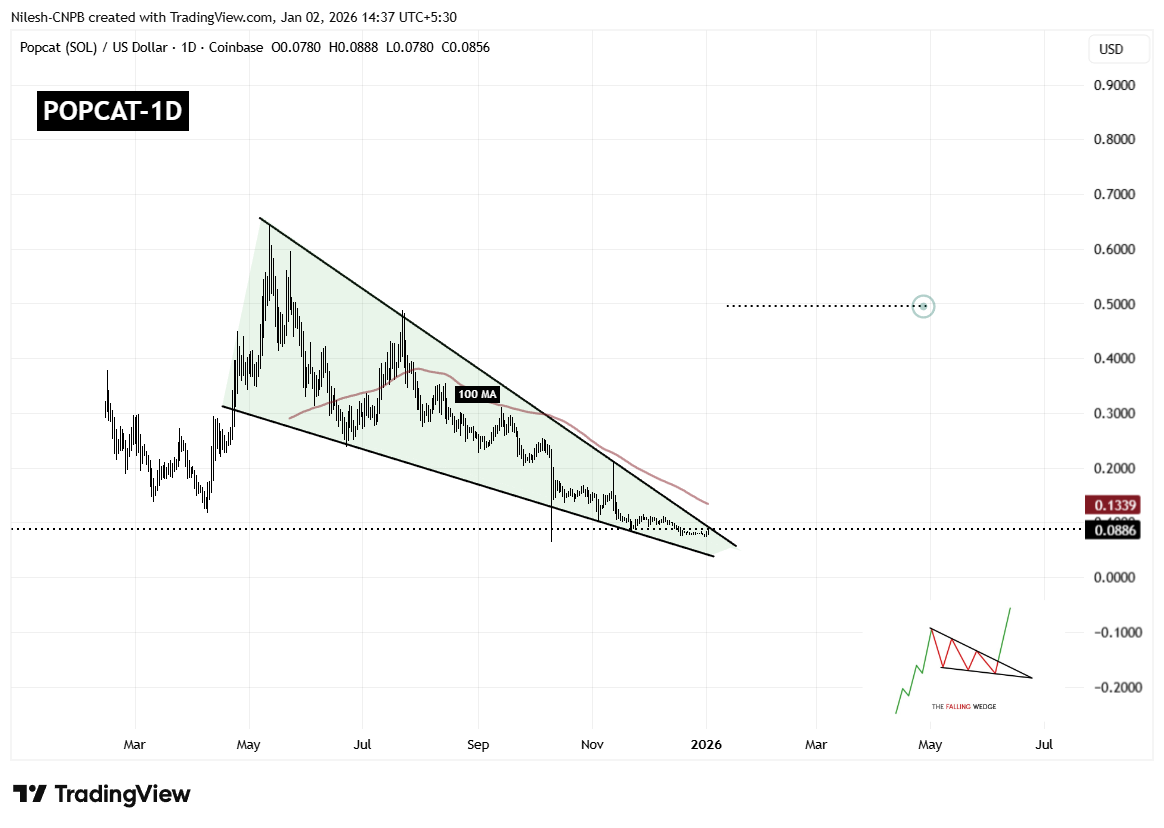
Popcat (POPCAT) Daily Chart/Coinsprobe (Source: Tradingview)
This compression near resistance is technically significant, as falling wedges tend to resolve with a sharp upside move once price breaks out of the structure. The longer price coils within the wedge, the stronger the eventual breakout tends to be.
However, overhead resistance remains notable. The 100-day moving average, currently hovering around $0.1339, represents a major technical barrier. This level has previously acted as dynamic resistance and will likely be a key area to watch if a breakout occurs.
What’s Next for POPCAT?
If buyers manage to push price decisively above the wedge resistance and reclaim the 100-day moving average with a strong daily close, POPCAT could confirm a bullish breakout. Such a move would mark a clear shift in trend structure and could open the door for a larger recovery rally.
Based on the measured move of the falling wedge pattern, the upside projection points toward the $0.49 region. Reaching this level would represent a substantial recovery from current prices and could attract renewed interest from momentum traders and sidelined participants.
That said, failure to break above resistance could result in continued consolidation. In a bearish scenario, POPCAT may revisit the $0.072 support zone once again. As long as this level continues to hold, the broader falling wedge structure would remain intact, keeping the bullish reversal thesis alive.
Overall, POPCAT is approaching a technically critical juncture. With price tightly compressed, selling pressure fading, and buyers defending key support levels, the coming sessions could prove decisive in determining whether this memecoin is ready to stage its next meaningful move higher.
Disclaimer: The views and analysis presented in this article are for informational purposes only and reflect the author’s perspective, not financial advice. Technical patterns and indicators discussed are subject to market volatility and may or may not yield the anticipated results. Investors are advised to exercise caution, conduct independent research, and make decisions aligned with their individual risk tolerance.
About Author: Nilesh Hembade is the Founder and Lead Author of Coinsprobe, with over 5 years of experience in the cryptocurrency and blockchain industry. Since launching Coinsprobe in 2023, he has been providing daily, research-driven insights through in-depth market analysis, on-chain data, and technical research.
Disclaimer: The information on this page may come from third parties and does not represent the views or opinions of Gate. The content displayed on this page is for reference only and does not constitute any financial, investment, or legal advice. Gate does not guarantee the accuracy or completeness of the information and shall not be liable for any losses arising from the use of this information. Virtual asset investments carry high risks and are subject to significant price volatility. You may lose all of your invested principal. Please fully understand the relevant risks and make prudent decisions based on your own financial situation and risk tolerance. For details, please refer to
Disclaimer.
Related Articles
Uptrend Encountering Resistance? Analysis: Bitcoin Rebound May Face Headwinds Between $75,000 and $85,000
Bitcoin is currently around $74,611, facing resistance near the $75,000 level, with $85,000 being a larger resistance zone. Despite bullish signals appearing in the derivatives market and a short-term uptick in risk appetite, the increase in Bitcoin flowing into exchanges may bring profit-taking pressure. Market focus is concentrated on the Federal Reserve's interest rate decision, and if the results fall short of expectations, it will affect the sustainability of Bitcoin's rebound.
区块客38m ago
Chainlink Dominates Discussion in RWA Sector
The RWA (Real World Asset) tokenization sector is drawing significant attention, highlighted by Chainlink's dominance with 14.2 million interactions, far surpassing other projects. The article examines market perceptions and potential for growth among top projects like ONDO and AVAX.
TapChiBitcoin1h ago
Fear and Greed Index Returns Above 40, BTC Weekly Gains 5.66%, ETH Weekly Gains 13%
Data from Xinfire Research Institute shows that from March 11-18, the Nasdaq index declined 1.26%, Bitcoin rose 5.66%, and Ethereum gained 13%. The Fear and Greed Index has exited the extreme fear zone. The Federal Reserve will release statements related to rate cuts tomorrow.
GateNews2h ago
Bitcoin Pulls Back to $73,500, Ethereum Consolidates at $2,300, CryptoQuant: Uptrend Faces Double Resistance, Fed Decision Thursday Becomes Key
Bitcoin reached a high of 75,500 USD today before pulling back to 73,910 USD. CryptoQuant points out that there is double resistance in the 75,000 to 85,000 USD range. The market is awaiting the Federal Reserve's interest rate decision announcement and Powell's assessment of stagflation. If the results are hawkish, it will increase resistance at the 75,000 USD level. Overall market sentiment remains consolidating sideways.
動區BlockTempo3h ago
CryptoQuant Alert: Bitcoin Bounce May Face Resistance Between 75,000 and 85,000 USD
CryptoQuant report shows bullish signals in the Bitcoin futures market, but if the price continues to rise, it will encounter resistance near $75,000 and $85,000. Meanwhile, the inflow of Bitcoin into centralized exchanges is accelerating, which may signal potential selling pressure, creating a contradiction with the bullish sentiment in the futures market.
MarketWhisper3h ago
Why Did Bitcoin Fall Today? Iran's Key Leader Dies, Hormuz Strait Faces Blockade Again
Recent reasons for Bitcoin's decline include geopolitical conflict uncertainty triggered by the death of Iranian wartime official Larijani, the blockade of the Strait of Hormuz pushing oil prices above $100, exacerbating inflation pressures and reducing Federal Reserve rate cut expectations, as well as institutional capital withdrawal. On the technical side, $72,000 is an important support level, and a break below could lead to further exploration toward $64,000.
MarketWhisper3h ago
