
Key Takeaways
-
SAND price is showing early signs of stabilization after recent downside pressure.
-
Buyers appear to be defending a key support zone, hinting at a potential short-term rebound.
-
A breakout above nearby resistance could open the door for a stronger recovery move.
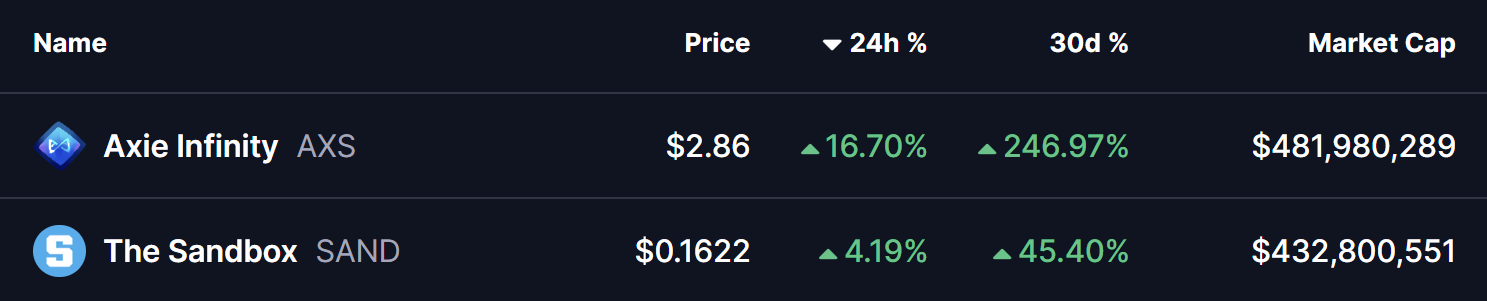
Gaming-focused crypto tokens are back in the spotlight after Axie Infinity (AXS) posted a sharp rally of over 16% in a single day and more than 246% over the past month, reigniting optimism around the gaming narrative. Riding this renewed momentum, Sandbox (SAND) has also stepped into focus, climbing nearly 45% as overall market sentiment turns constructive.
Beyond the recent price bounce, the technical structure on the chart is starting to tell a bigger story, hinting that SAND may be setting up for a bullish continuation move.
Source: Coinmarketcap
Descending Broadening Wedge Pattern in Play
On the daily timeframe, SAND is trading within a descending broadening wedge — a bullish reversal pattern that often develops during corrective phases before a trend shift. This structure reflects increasing volatility, with price gradually compressing while buyers quietly regain control.
During the latest pullback, SAND successfully retested the lower boundary of the wedge near the $0.11 zone, an area that has repeatedly acted as strong demand. Buyers stepped in aggressively at this level, triggering a rebound that pushed price toward $0.1711, placing SAND right near the wedge’s upper resistance trendline.
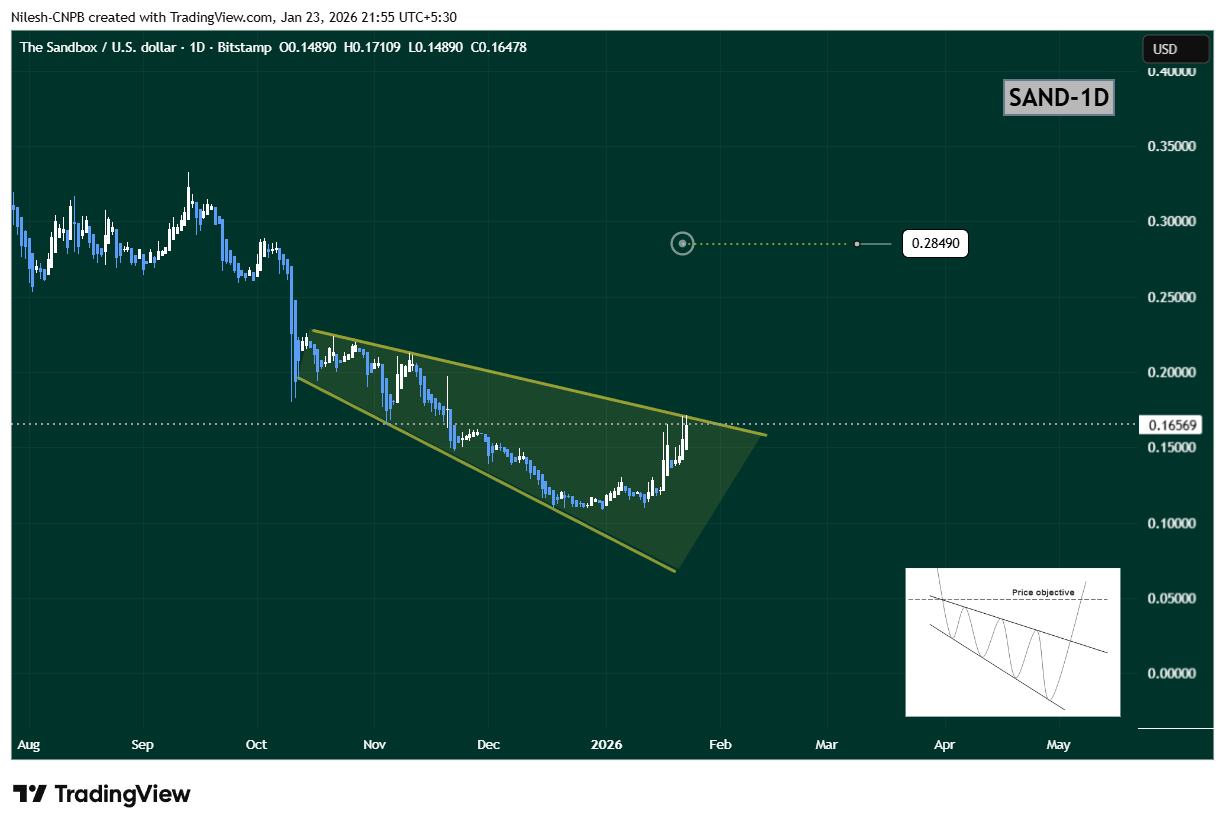
Sandbox (SAND) Daily Chart/Coinsprobe (Source: Tradingview)
The steady rise toward this upper boundary suggests growing bullish momentum and increasing breakout pressure.
What’s Next for SAND?
If buyers manage to push SAND above the upper wedge resistance near $0.1711, it would confirm a bullish breakout from the pattern. In that scenario, the chart opens the door for a move toward the $0.2849 target, which aligns with the measured move of the wedge and represents roughly 73% upside from current levels.
However, if price faces rejection at resistance, SAND could continue consolidating within the wedge structure. In that case, the $0.13–$0.14 region will act as an important short-term support zone to watch.
Bottom Line
SAND’s overall technical structure remains constructive. With a bullish descending broadening wedge in play, buyers defending key support, and gaming tokens gaining renewed attention, Sandbox appears to be positioning for a potential breakout. A confirmed move above resistance could mark the beginning of a stronger upside phase in the sessions ahead.
Disclaimer: The views and analysis presented in this article are for informational purposes only and reflect the author’s perspective, not financial advice. Technical patterns and indicators discussed are subject to market volatility and may or may not yield the anticipated results. Investors are advised to exercise caution, conduct independent research, and make decisions aligned with their individual risk tolerance.
About Author: Nilesh Hembade is the Founder and Lead Author of Coinsprobe, with over 5 years of experience in the cryptocurrency and blockchain industry. Since launching Coinsprobe in 2023, he has been providing daily, research-driven insights through in-depth market analysis, on-chain data, and technical research.
Disclaimer: The information on this page may come from third parties and does not represent the views or opinions of Gate. The content displayed on this page is for reference only and does not constitute any financial, investment, or legal advice. Gate does not guarantee the accuracy or completeness of the information and shall not be liable for any losses arising from the use of this information. Virtual asset investments carry high risks and are subject to significant price volatility. You may lose all of your invested principal. Please fully understand the relevant risks and make prudent decisions based on your own financial situation and risk tolerance. For details, please refer to
Disclaimer.
Related Articles
Rising oil prices spark heated discussion in the crypto community: Will Bitcoin become an inflation hedge?
International oil price fluctuations have sparked heated discussions in the crypto community, focusing on the impact of oil prices on Bitcoin trends. Analysts believe that geopolitical risks and inflation pressures have made oil a focal point, with some traders expressing concern about Bitcoin's safe-haven properties, though doubts remain. Currently, market interest in altcoins is subdued, with main attention on macroeconomic trends and commodity movements.
GateNews7m ago
XRP Price Breakout Signal Appears: Symmetrical Triangle Critical Point Approaching, $2 Target May Come Into View
XRP price has recently rebounded by approximately 4%, approaching a breakout of a key technical pattern. The market is watching to see if it will break through the upper boundary of the symmetrical triangle, with a potential target price of $2.06. Although the growth in stablecoin supply has boosted market sentiment, outflows of institutional funds warrant caution. The current trend still requires close monitoring.
GateNews16m ago
Cardano Posts 6.89% Daily Gain—Can ADA Maintain Momentum Above $0.25?
Cardano posts 6.89% daily gain as ADA rebounds to $0.2811 after recent yearly lows.
Strong trading volume signals renewed investor interest and potential short-term momentum.
Traders watch $0.25 support and $0.30 resistance for ADA’s next direction.
Cardano’s ADA returned to the
CryptoNewsLand26m ago
Circle stock price surges 87% in a month! How the US-Iran war and trader position adjustments are driving the rally?
Circle's stock price surged 87% in a single month due to the impact of the US-Iran conflict. Analysts have pointed out that its stock is overvalued, and the discounted cash flow model shows an intrinsic value of $42.25. The current stock price of $111.84 is 164.7% higher. The price-to-sales ratio also emphasizes that the stock is overvalued, indicating a high risk of overestimation.
CryptoCity31m ago