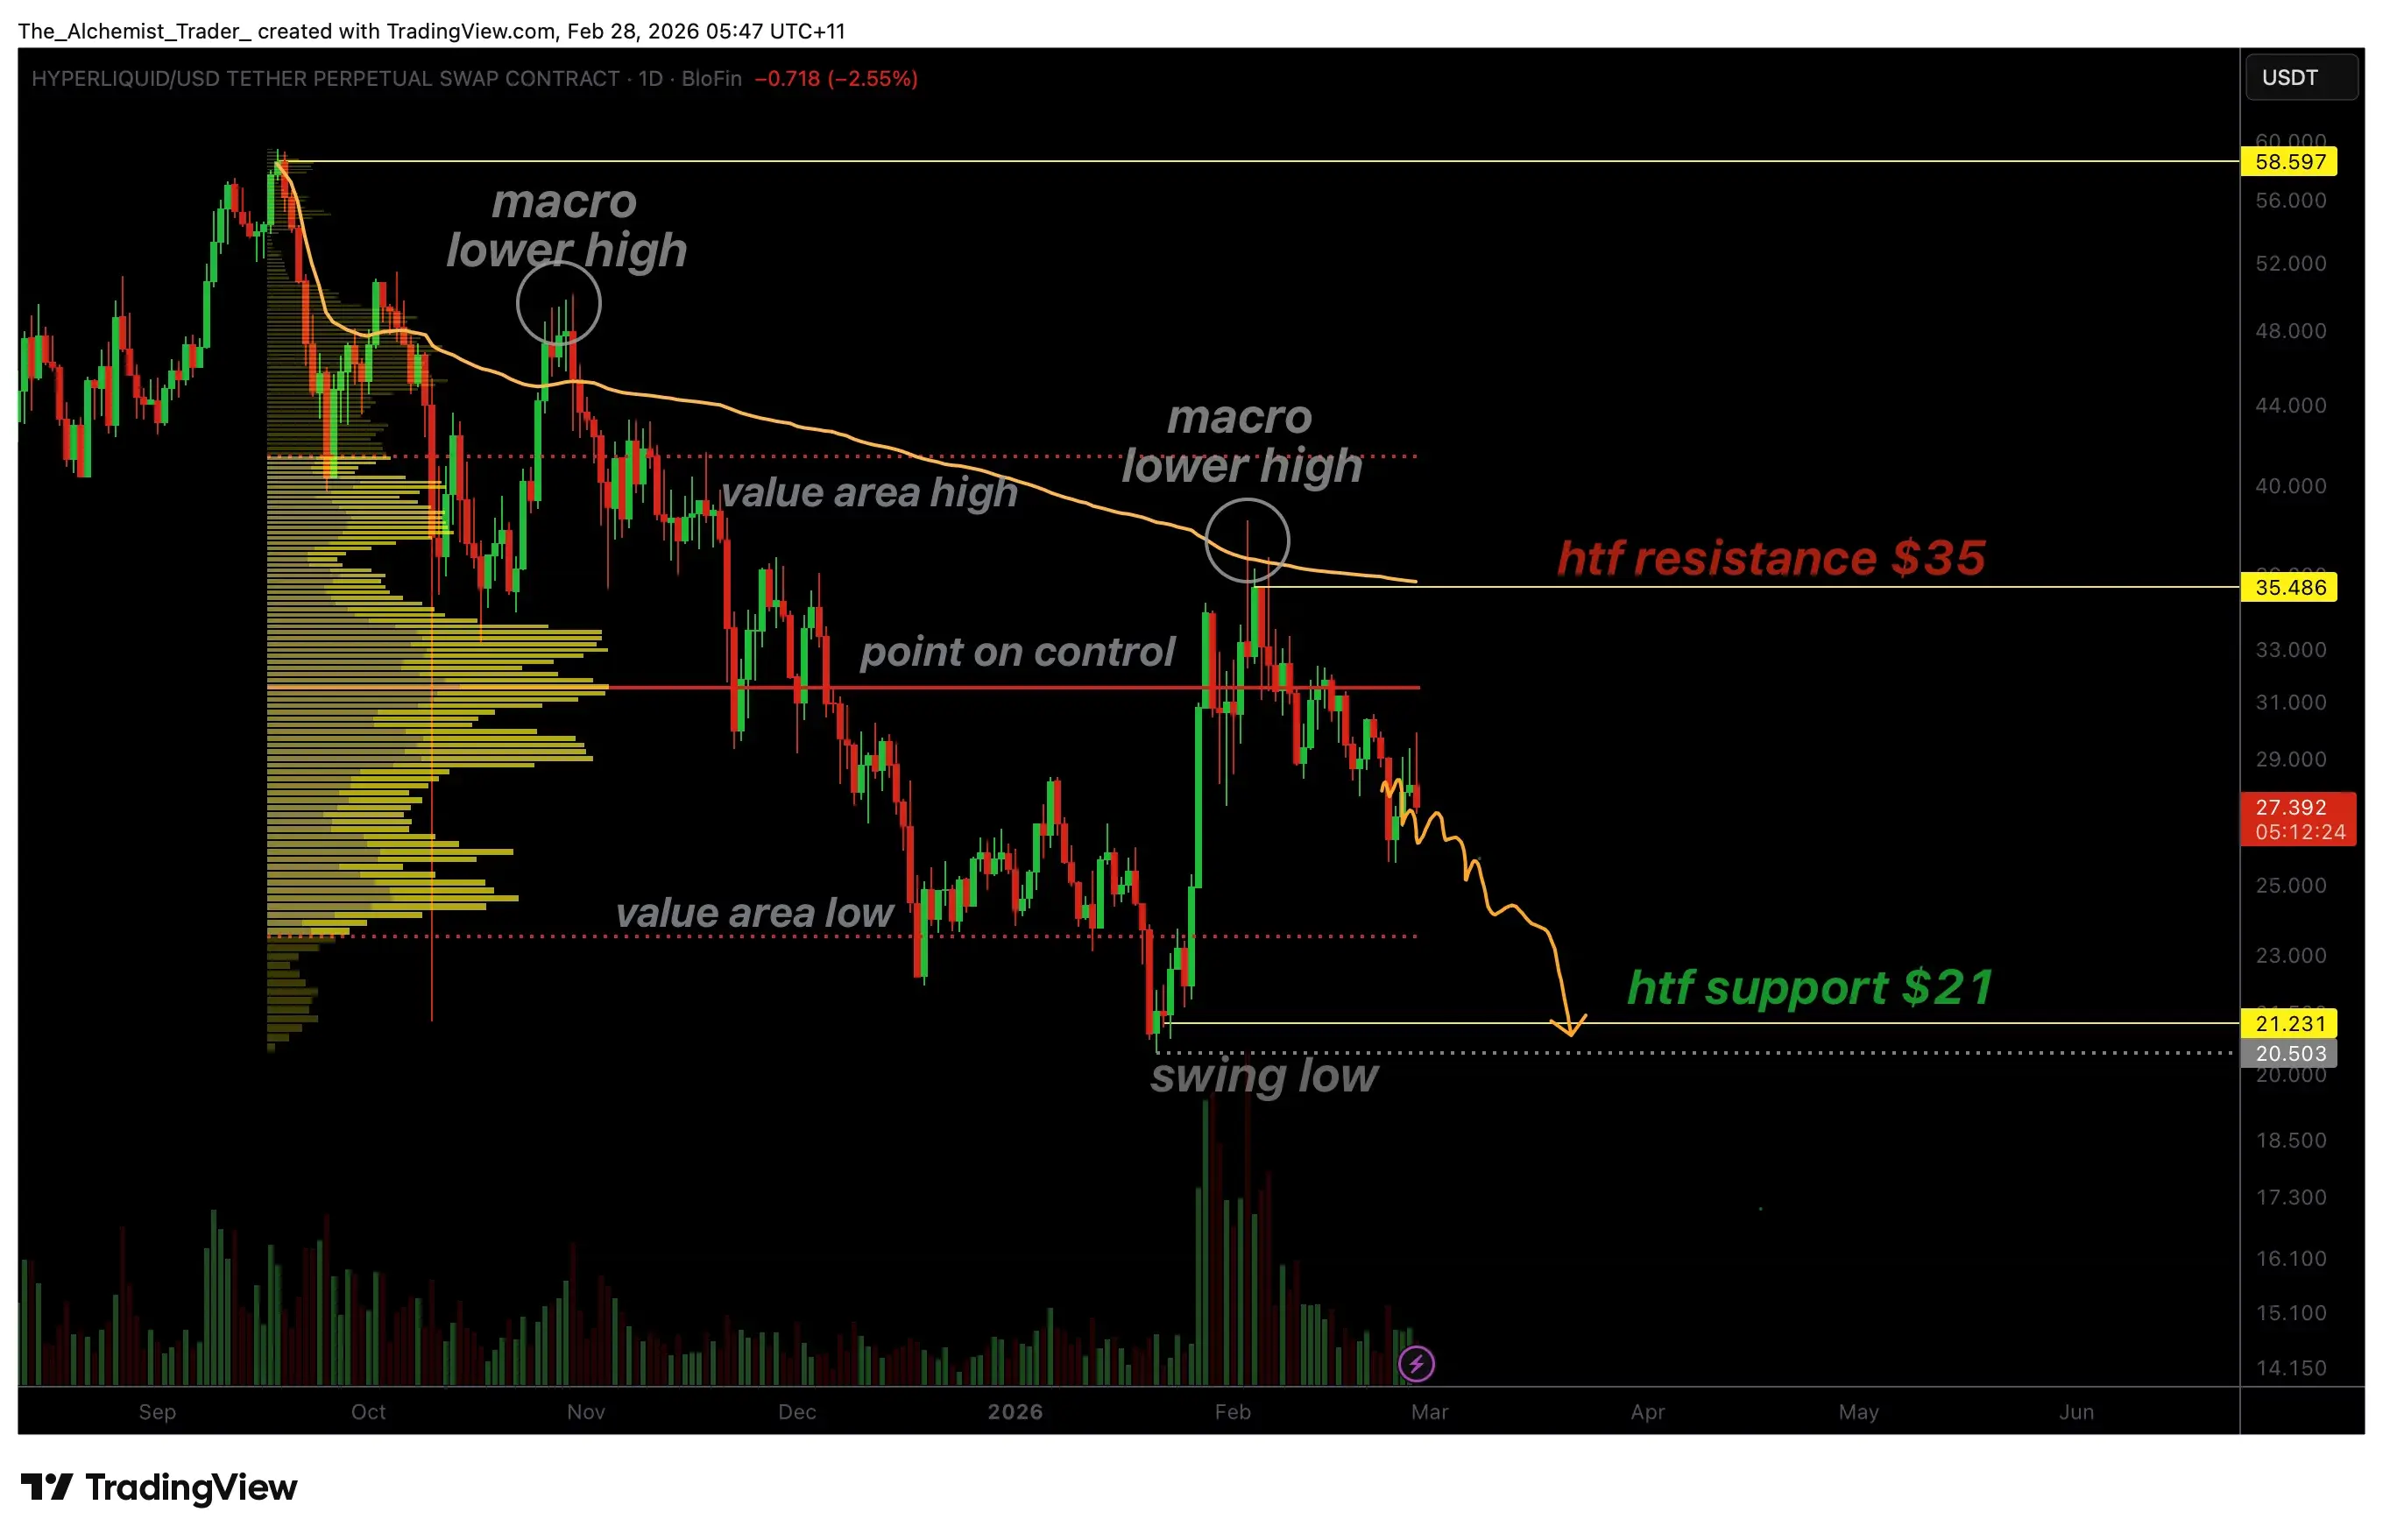
February 28 News: Hyperliquid’s price faces resistance at high levels again, forming a macro “lower high” structure, with ongoing correction pressure increasing. After failing to regain a key volume zone, technical indicators point to the next significant support area around $22.
From a higher time frame, Hyperliquid remains in a clear bearish structure. The price has rebounded multiple times but continues to make lower highs, with no substantial trend reversal. Recent rebounds around $35 encountered resistance at this level, which coincides with the volume-weighted average price (VWAP) and the high point of the value area, forming a strong resonance resistance zone. The price pulled back under pressure, indicating sellers still hold the dominant position.
After being blocked, the market retreated to the Point of Control (POC). The POC represents the most traded price area within the current range, often serving as a key dividing line between bulls and bears. However, Hyperliquid failed to stabilize above the POC and instead broke below this volume support, suggesting insufficient demand and increasing likelihood of trend continuation.
Following the loss of POC support, the market entered a new correction phase. Technical structure shows that if the price continues to trade below the POC and faces resistance at higher cycle levels, liquidity may shift down to the $22–$21 range. This zone is not only a previous swing low but also a potential phase panic release area, regarded as an important medium- to long-term demand test zone.
 (Source: TradingView)
For investors monitoring Hyperliquid’s price trend, whether $22 can form an effective support will be a key point in judging whether the trend will further deteriorate. A volume-supported rebound in this area could create conditions for subsequent structural recovery; if it fails to hold, deeper correction risks should be watched. Under the current technical landscape, the market remains cautious.
(Source: TradingView)
For investors monitoring Hyperliquid’s price trend, whether $22 can form an effective support will be a key point in judging whether the trend will further deteriorate. A volume-supported rebound in this area could create conditions for subsequent structural recovery; if it fails to hold, deeper correction risks should be watched. Under the current technical landscape, the market remains cautious.
Disclaimer: The information on this page may come from third parties and does not represent the views or opinions of Gate. The content displayed on this page is for reference only and does not constitute any financial, investment, or legal advice. Gate does not guarantee the accuracy or completeness of the information and shall not be liable for any losses arising from the use of this information. Virtual asset investments carry high risks and are subject to significant price volatility. You may lose all of your invested principal. Please fully understand the relevant risks and make prudent decisions based on your own financial situation and risk tolerance. For details, please refer to
Disclaimer.
Related Articles
BTC 15-minute increase of 1.06%: Macroeconomic liquidity expectations and institutional buying resonance driving the market
On March 3, 2026, from 12:00 to 12:15 (UTC), BTC experienced a significant surge, with a 15-minute return of +1.06%. The price ranged from 67,030.1 to 67,966.1 USDT, with an amplitude of 1.40%. This movement attracted widespread market attention, with active short-term trading and increased volatility indicating accelerated capital inflows into mainstream cryptocurrencies.
The main drivers of this movement were the optimistic macroeconomic policy expectations and the resonance of buy orders from leading institutions. As the Federal Reserve's interest rate meeting approaches, the market generally expects to maintain stable interest rates and to conclude quantitative tightening (QT) before May.
GateNews8m ago
ETH short-term increase of 1.04%: Spot buying driven and deflation expectations resonate to amplify the rally
March 3, 2026 12:00 to 12:15 (UTC), ETH prices rapidly rose within the range of 1960.84 to 1990.3 USDT, recording a 1.04% return with an amplitude of 1.50%. The candlestick data reflect significant market activity during this period, with trading volume and volatility both at high levels, attracting widespread market attention.
The main driver of this movement is active spot market buying, which pushed short-term prices higher. At the same time, leveraged funds in the futures market participated heavily, with open interest exceeding $25 billion, and approximately $96.85 million in long and short funds within the market.
GateNews8m ago
Bitmine scans another 50,000 ETH! Tom Lee Looks Forward to a Rebound in March
Bitmine Immersion Technologies (BMNR) announced that as of March 1, it holds 4.47 million ETH, valued at $8.8 billion, making it the publicly listed company with the largest holdings of Ethereum worldwide. Despite the market downturn, Bitmine continues to increase its ETH holdings and plans to launch its own "Made in USA Validator Network," which is expected to generate an annualized revenue of $249 million.
区块客15m ago
BTC Makes Green Daily Candle Despite Iran War
Bitcoin ($BTC) rose to $68,113, showing resilience amidst the U.S.-Iran conflict. It experienced a 1.9% increase and a market cap of $1.36T. With key resistance at $70K, March is critical for its future amid geopolitical tensions.
BlockChainReporter21m ago
Iranian conflict未抑制 buying interest! Bitcoin spot ETF inflows of $458 million in a single day
Amid military strikes by the United States and Israel against Iran, the US Bitcoin spot ETF attracted a net inflow of $458 million, pushing Bitcoin prices close to $70,000. Institutional investors believe that geopolitical risks are short-term shocks, with market leverage levels declining, and no systemic risk being triggered. The options market also shows a calm atmosphere, reflecting traders' preference for short-term hedging rather than long-term bearishness.
区块客26m ago
VanEck CEO Says Bitcoin Nears Bottom in 4-Year Cycle
_VanEck CEO Jan van Eck says Bitcoin nears bottom in 4-year cycle as 2026 price targets divide analysts._
Bitcoin may be approaching the end of its current bear market phase. VanEck CEO Jan van Eck said the price is forming a bottom. He expressed this view in an interview with CNBC on
LiveBTCNews39m ago