
Hedera’s story is starting to look different. Over the past few days, the conversation around Hedera (HBAR) has shifted from pure speculation to real-world infrastructure use cases. The network was highlighted among high-upside altcoins if broader market momentum returns.
However, a senior U.S. Department of Transportation official patented a national road-use fee system built around Hedera’s hashgraph technology. That’s not typical crypto chatter, that’s institutional-grade direction.
Technically, HBAR has also been showing relative stability versus Bitcoin. While BTC experienced sharp swings, the HBAR price has been consolidating and forming a base. With price currently around $0.09716, traders are watching for a potential March breakout.
- Here’s What The Hedera Chart Is Showing
- What the Indicators Are Showing
- March Price Targets for HBAR
Here’s What The Hedera Chart Is Showing
We had a look at the 4-hour HBAR chart, and the broader structure is still corrective, but something has changed.
The HBAR price topped near the $0.21 region months ago and has been in a steady decline since, printing lower highs consistently. However, the recent structure shows stabilization around the $0.07–$0.09 zone. That area acted as a firm support in early February and has held through multiple retests.
Price is now consolidating just under the $0.10 level. That psychological barrier is acting as short-term resistance. Every attempt above it has seen modest rejection, but sellers are no longer aggressively pushing price lower.
The structure right now looks like compression. Volatility has decreased. That often precedes expansion, the only question is direction.
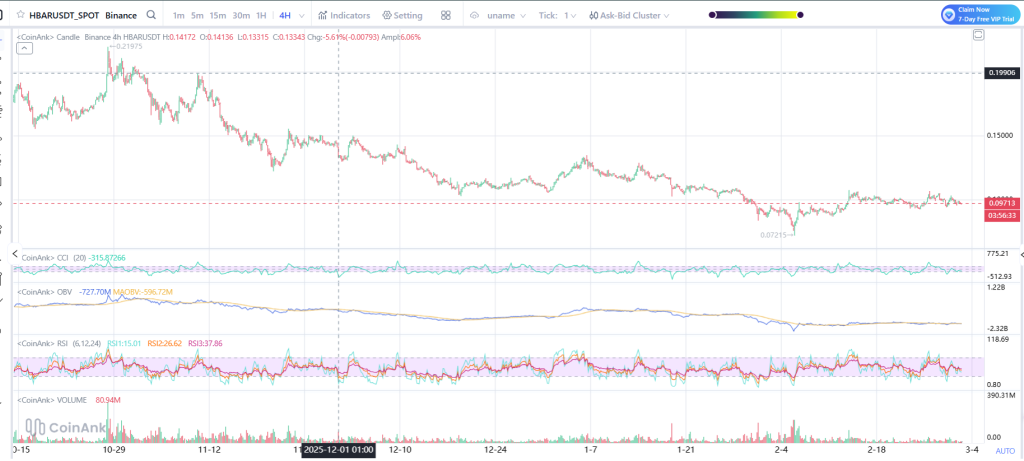
Source: Coinank
What the Indicators Are Showing
CCI is fluctuating near oversold territory but not deeply extended. That reflects consolidation rather than capitulation.
On-Balance Volume has flattened after a prolonged decline. That suggests selling pressure is cooling. It doesn’t confirm strong accumulation yet, but it shows distribution is slowing.
RSI sits near the mid-to-low 40s range. That signals weak momentum but not exhaustion. There is room for upside expansion if buyers step in.
Volume remains moderate. For a decisive move, we would need a clear pickup in participation.
Overall, indicators suggest HBAR is building a base, not breaking down.
_****IRAN Is About to Make The Stock Market Go Insane**
March Price Targets for HBAR
With HBAR trading near $0.09716, the key levels are clearly defined.
If the Hedera price breaks and holds above $0.10, the first upside target sits near $0.12–$0.13, which aligns with prior breakdown structure from January. A stronger push could extend toward $0.15, marking the next major resistance zone.
If broader crypto momentum returns and capital rotates into infrastructure-focused altcoins, a March extension toward $0.18–$0.20 becomes possible. That area aligns with the previous major distribution range.
On the downside, failure to hold $0.09 would expose the $0.072–$0.075 support region again. A breakdown below that shifts the structure back into bearish continuation mode.
Right now, the HBAR price is not trending aggressively, it is compressing. March will likely be defined by whether $0.10 flips into support. If it does, the recovery move could accelerate quickly.
Disclaimer: The information on this page may come from third parties and does not represent the views or opinions of Gate. The content displayed on this page is for reference only and does not constitute any financial, investment, or legal advice. Gate does not guarantee the accuracy or completeness of the information and shall not be liable for any losses arising from the use of this information. Virtual asset investments carry high risks and are subject to significant price volatility. You may lose all of your invested principal. Please fully understand the relevant risks and make prudent decisions based on your own financial situation and risk tolerance. For details, please refer to
Disclaimer.
Related Articles
BTC 15-minute rally of 0.85%: Fed policy shift and ETF capital resonance drive buying momentum
From 2026-03-12 09:30 to 2026-03-12 09:45 (UTC), Bitcoin (BTC) experienced a rapid surge within a 0.93% volatility range, achieving a return of +0.85%, with prices fluctuating between 69678.0 and 70324.2 USDT. Trading volume increased approximately 38% compared to the previous hourly average. Market attention surged significantly, with short-term bullish sentiment amplified notably.
The primary driver of this market movement was the Federal Reserve Chair's early morning release of policy shift signals, hinting that the pace of future rate hikes may slow down. The market broadly interpreted this as a marginal improvement in the liquidity environment
GateNews47m ago
PI Token Maintains Bullish Trend as Anticipation for Pi Day Grows
PI token trades above $0.21 after rallying over 25% in the past 7 days as anticipation for the upcoming Pi Day on March 14 grows.
PiScan recorded 3 million PI deposits to exchanges in 24 hours, suggesting near-term profit taking which could reverse the bullish trend.
Pi Network’s PI token tr
CryptoNewsFlash53m ago
Why Didn't BTC Drop During Geopolitical Conflicts? Answers From Binance's Fund Structure and CVD
The article analyzes the relationship between Binance's BTC balance changes and market demand, indicating that the decrease in BTC balances in the short term is related to genuine demand, especially during the US-Iran conflict. The widening gap in spot trading volume suggests active buying activity, supporting the presence of real demand. Although short-term demand may stabilize BTC prices, the long-term trend still leans downward, and the process of demand recovery could be lengthy.
PANews55m ago
Glassnode Data: Most XRP Supply in Loss, What It Means for Investors
Glassnode data shows 36.8 billion XRP, nearly 60% of the circulating supply, is held at a loss, with unrealized losses reaching $50.8 billion.
XRP traded near $1.34, while futures volume jumped on BitMEX and Binance as ETF outflows and weak spot activity kept pressure on price.
Glassnode dat
CryptoNewsFlash1h ago
23.38% Surge for OGN: What It Means for Investors
OGN's price surged 23.38% in 15 minutes, currently at $0.03356, driven by robust trading volume and market activity. Analysts cite macroeconomic factors and regulatory news influencing investor sentiment, while traders monitor key resistance and support levels.
Coinfomania1h ago
Bitcoin Supply Shock Imminent? Whale Holdings in Dormancy, Retail Selling Intensifies Price Volatility
The Bitcoin market is undergoing structural changes, with short-term holders selling off due to financial pressures, while long-term investors remain dormant, indicating potential supply shocks. Currently, Bitcoin is priced at $69,446, and although some holdings are at a loss, the stability of long-term holders could support the market. Analysts advise paying attention to on-chain indicators and whale activity to evaluate future price trends and liquidity risks.
GateNews1h ago